
Page 77 - Haematologica July
P. 77
Exosomal miRNAs in AA and MDS
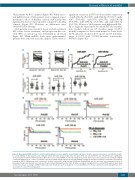
SAA patients by ROC analysis (Figure 4B). When exoso- mal miRNA levels of SAA patients were compared at post treatment to those of healthy controls, miR-126-5p was significantly decreased in responders compared to healthy controls (Figure 4C). However, no differences were observed before therapy.
SAA patients were classified based on fold regulation (FR) values before treatment, and progression-free sur- vival (PFS) of each group was determined as shown in Figure 4D. When miRNA levels were undetermined, patients were removed from the analysis. There were no
significant variations in PFS based on relative expression of miR-196a-5p (P=0.239), miR-196b-5p (P=0.317), miR- 4267 (P=0.362), miR-378i (P=0.751), miR-19b-3p (P=0.093), miR-1180-3p (P=0.069), and miR-3200-3p (P=0.744). However, SAA patients with higher miR-126- 5p at diagnosis experienced decreased PFS (8.5 months; n=6; median follow up 6.9 months; range 3.2-25.3 months) compared to those with normal or lower levels (n=36 and n=11; median follow up 22.7 and 37.4 months; range 0.3-109.3 and 3-109.5 months, respectively; P=0.013) (Figure 4D).
AB
C
D
Figure 4. Exosomal miRNAs and their correlation with prognosis in severe aplastic anemia (SAA) responders. Relative expression levels were calculated as Log2FC for all 48 miRNAs in SAA patients and compared before and after immunosuppressive therapies (IST). (A) Only miR-4651 and miR-126-5p were significantly decreased after treatment in SAA-responders. (B) For these 2 exosomal miRNAs, receiver operating characteristic (ROC) curves were generated as described in Figure 3 using a healthy group as a control. (C) Relative expression of differentially expressed exosomal miRNAs at diagnosis and after treatment in responders (R) and non- responders (NR) of SAA patients were compared to healthy controls (HC) using one-way ANOVA with Kruskal-Wallis and the two-stage linear step-up procedure of Benjamini, Krieger and Yekutieli tests. Data are shown as mean+Standard Deviation (SD). (D) After calculation of progression-free survival (PFS), patients were divid- ed into three groups according to miRNA relative expression shown as Log2FC at diagnosis of selected miRNAs. P<0.05 was considered statistically significant. AUC: area under the curve; FR: fold regulation.
haematologica | 2018; 103(7)
1155
