
Page 78 - Haematologica July
P. 78
1156
V. Giudice et al.
Pathway analysis of exosomal miRNAs
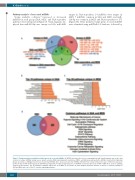
Using available software,35 increased or decreased miRNAs in each group (SAA, MDS, and SAA-responder patients) were interpolated (Figure 5). Venn diagrams dis- played that miR-532-5p was unique in SAA, miR-4651
unique in SAA-responders, 14 miRNAs were unique in MDS, 7 miRNAs common in SAA and MDS, and miR- 126-5p was common in MDS and SAA-responders to IST (Figure 5A). Next, predicted target genes for each miRNA were identified using miRWalk 2.0 database, followed by
A
BC
D
Figure 5. Pathway analysis using differentially expressed exosomal miRNAs. (A) VENNY (an interactive tool for comparing lists with Venn Diagrams) was used to find common or unique miRNAs among severe aplastic anemia (SAA), myelodysplastic syndromes (MDS), and SAA-responder patients. miRNAs classified into individual groups are listed accordingly. Red: increased exosomal miRNAs; blue: decreased exosomal miRNAs; miR-3200-3p is shown in black because of different expression profiles between SAA (down-regulated) and MDS (up-regulated). Predicted targeted genes of miRNAs exclusively expressed in SAA or MDS were used for pathway analysis by IPA software. Top 10 pathways in SAA (B) and the top 20 in MDS (C) are shown. (D) Venn diagram shows the number of unique or common pathways in SAA and MDS and a list of the 15 common signaling pathways.
haematologica | 2018; 103(7)
