
Page 75 - Haematologica July
P. 75
Exosomal miRNAs in AA and MDS
423-3p, miR-1193, and miR-143-3p were higher in MDS patients relative to SAA and controls. Other miRNAs did not show variations in either SAA or MDS.
Association of exosomal miRNAs with diseases
To assess specificity and sensitivity of exosomal miRNAs for the diagnosis of SAA and MDS, a receiver operating characteristic (ROC) curve analysis was employed using the validation set samples (Figure 3 and Online Supplementary Table S3). miR-196a-5b [area under the curve (AUC), 0.74], miR-196b-5p (AUC, 0.74), miR- 4267 (AUC, 0.71), miR-378i (AUC, 0.75), miR-19b-3p (AUC, 0.68), miR-1180-3p (AUC, 0.64), miR-423-3p (AUC, 0.63), miR-532-5p (AUC, 0.65), miR-574-3p (AUC, 0.64), and miR-3200-3p (AUC, 0.77) showed strong asso- ciations with SAA. Other miRNAs were not statistically significantly associated with the disease.
In MDS patients, 21 exosomal miRNAs displayed strong association with the disease (Figure 3B). Strong associa- tion was observed in all 7 miRNAs present in both SAA and MDS patients with the highest AUC value (0.99) of miR-378i, followed by miR-574-3p (AUC, 0.87), miR- 196a-5p (AUC, 0.85), miR-3200-3p (AUC, 0.83), miR- 196b-5p (AUC, 0.79), miR-1180-3p (AUC, 0.79), miR-4267 (AUC, 0.74), and miR-19b-3p (AUC, 0.67).
Correlation with clinical parameters
Pearson correlation analysis was used to investigate cor- relation of exosomal miRNAs with clinical parameters of hemoglobin (Hb), white blood cell (WBC) count, platelet
(Plt) count, absolute neutrophil count (ANC), absolute lymphocyte (ALC) and absolute reticulocyte counts (ARC), and lactate dehydrogenase (LDH) level in MDS patients and in SAA patients (before and after IST) from the validation set (Online Supplementary Table S4). Correlation with LDH was included in the analysis because higher LDH has been related to hemolysis and to disease progression in many malignant hematologic disor- ders.34 No association was found between any exosomal miRNA and Hb at diagnosis and after treatment. miR-574- 3p and miR-4274 were positively associated with WBC (r=-0.332, P=0.021) and Plt (r=0.330, P=0.021) counts at diagnosis, respectively, but not after IST. miR-15a-3p (r=0.312, P=0.026), miR-532-5p (r=0.368, P=0.010), and miR-26b-3p (r=0.364, P=0.017) positively correlated with an LDH level before therapy. miR-103a-3p and miR-29c- 3p positively correlated with ANC before IST, while miR- 126-5p negatively correlated after treatment (r=-0.326, P=0.040). miR-4651 was positively related to ARC before therapy, but no miRNAs were found after IST. However, SAA patients after treatment displayed negative correla- tions between ALC and several miRNAs: miR-3200-3p, miR-196a-5p, miR-28-3p, miR-133b, miR-26b-3p, let-7b- 5p, miR-133a-3p, and miR-106b-5p (Online Supplementary Table S4). In MDS, miR-1180-3p was positively correlated with a Hb level (r=0.483, P=0.036) and WBC count (r=0.561, P=0.013), while miR-3200-3p (r=0.963, P=0.002), miR-196b-5p (r=0.485, P=0.035), miR-378i (r=0.498, P=0.030), and miR-1260a (r=0.495, P=0.037) only to WBC count. No miRNAs showed a correlation with Plt count or
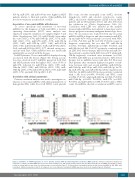
ABC
D
Figure 2. Validation of miRNA signatures in severe aplastic anemia (SAA) and myelodysplastic syndromes (MDS) patients. Principal component analysis was employed to compare the 48 miRNA expression levels in the validation set: SAA versus healthy controls (HC) (A), MDS versus HC (B), and MDS versus SAA (C). These results are shown with volcano plots in a similar manner as described in Figure 1. (D) Hierarchical clustering visualizes the 48 exosomal miRNAs in SAA, MDS, SAA- responders, SAA-non-responders, and HC. A red-green color scale indicates normalized miRNA expression levels (red: maximum; green: minimum).
haematologica | 2018; 103(7)
1153
