
Page 125 - Haematologica July
P. 125
7y follow-up of monoclonal B-cell lymphocytosis
had not been reached yet, a significantly shorter OS was observed for MBLlo individuals vs. age- and sex-matched non-MBL controls from the same cohort and geographical area (10y OS rates of 76% vs. 86%, respectively; P=0.03) (Figure 2A,B). Moreover, MBLlo subjects also showed a sig- nificantly shortened survival vs. age-matched individuals of the general population from the same geographical region (8.0% vs. 1.8% in the period 2015-2016, respectively; P<0.001) (Online Supplementary Figure S1). Interestingly, such differences in OS were at the expense of a lower OS of CLL-like MBLlo females, who showed a significantly (P=0.01) higher risk of death (hazard ratio (HR) of 2.5; 95% confidence interval (CI) of 1.2-5.4) than non-MBL females of the same age (Figure 2C,F). Infections (21%; mostly res- piratory infections and sepsis), cancer (36%; all solid tumors except for an essential thrombocythemia) and cardiovascu- lar diseases (29%; i.e., myocardial infarction and acute ischemic stroke) were the main causes of death among MBLlo subjects. Overall, infections were overrepresented among the MBLlo cohort vs. age- and sex-matched subjects from the general population of the same geographical area (21% vs. 1.4%, respectively; P≤0.001). In contrast, the pro- portion of deaths caused by tumors (36% vs. 26%, respec- tively; P>0.05) and by cardiovascular diseases (29% vs. 33%, respectively; P>0.05) were similar in both groups. In
turn, no MBLlo subjects died as a cause of non-infectious res- piratory tract diseases or genitourinary diseases, diabetes, dementia or other nervous system disorders, which accounted for ≈30% of deaths in the age- and sex-matched general population cohort living in the same geographical area. In order to identify those variables independently associated with OS, a multivariate Cox regression analysis, including laboratory, epidemiological and medical informa- tion, was carried out. Advanced age- HR of 5.1; 95% CI: 1.5-17.5; P=0.01-, co-existing cardiovascular diseases (HR: 2.7; 95%CI: 1.3-5.4; P=0.01), solid tumors (HR: 2.9; 95%CI: 1.3-6.5; P=0.007) and, to a lesser extent, the presence of MBLlo clones (HR: 2.1, 95%CI: 0.97-4.7; P=0.06), were inde- pendently associated with a shorter OS in the whole cohort (Table 5 and Online Supplementary Table S6).
Discussion
Several preceding studies have shown that virtually all CLL cases are preceded by MBLhi;8,20,21 in contrast, such a relationship has not been demonstrated for MBLlo cases, its role as a preleukemic condition still remaining to be confirmed.9,21 In fact, there exist very few studies with short-term follow-up (i.e., ≤3y) which have investigated
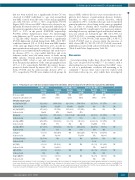
Table 3. Frequency of cases with CLL-associated cytogenetic alterations and percentage of cells affected by each genetic abnormality.
All MBLlo cases Baseline (n=31) 10/31
(32%)
CLL-like MBLlo cases
Non CLL-like MBLlo cases P
Follow-up (n=56) 34/56
(61%)
Baseline (n=24) 7/24
(29%)
6/20 (30%) 56±34% 3/15 (20%) 14±3% 1/19 (5.3%)¥ 59% 0/10 (0%) NA
0/8 (0%) NA
NA
NA NA NA NA
Follow-up # (n=50) 31/50
(62%)
27/48 (56%) 32±27% 1/7 (14%) 47% 1/49 (2%)¥ 70% 0/48 (0%) NA 1/48 (2.1%)
Baseline (n=7) 3/7
(43%)
1/2 (50%) 8% NA
1/2 (50%) 9%
2/2 (100%) 39±44% 1/2 (50%)
Follow-up (n=6) 3/6
(50%)
1/6 (17%)
7% NA NA NS
1/6 (17%) NS 20%
1/6 (17%) NS 50%
N. of cases with
cytogenetic alterations (%)
Chromosomal region
del(13q14)(D13S25)
% altered cells
del(13q14)(RB1)
% altered cells
Trisomy 12
% altered cells
del(11q)(ATM)
% altered cells
del(17p)(TP53)
%alteredcells 13% 10%
0.01a,b
7/22 (32%) 49±36% 3/15 (20%) 14±3% 2/21 (10%) 34±35% 2/12 (17%) 39±44% 1/10 (10%)
28/54 (52%) 31±27% 1/7 (14%) 47% 2/55 (3.6%) 45±35% 1/54 (1.9%) 50% 1/54 (1.9%)
0.06b
0/6 (0%) NS 10% 13% NA
t(14q32)*
% altered cells
t(11;14)(q13-q32)
% altered cells
del(7q32)
% altered cells
3q27 (BCL6)
% altered cells
18q21 (MALT1)
% altered cells
0/5 (0%) NA 1/2 (50%) 100% 0/1 (0%) NA 0/1 (0%) NA 0/2 (0%)
7/27 (26%) 33±30% NA
2/5 (40%) 20±2.1% 0/5 (0%) NA
5/23 (22%) 31±33% NA
NA NA NA
0/4 (0%) NA 1/2 (50%) 100% 0/1 (0%) NA 0/1 (0%) NA 0/2 (0%)
2/4 (50%) NS 38±30%
NA NA
2/5 (40%) NS 20±2.1%
0/5 (0%) NS
NA
0/4 (0%) NA
0/4 (0%) NA NA
NA NA
Results expressed as number of cases (percentage of cases) and mean ± SD of percentage of cells affected by each specific genetic alteration. aBaseline vs. follow-up (year +7) for all cases. bBaseline vs. follow-up (year +7) for CLL-like MBL cases. cBaseline vs. follow-up (year +7) for non CLL-like MBL cases. # 2/50 individuals carried a clonal MBLlo CLL- likepopulationalongwithatleastoneMBLlo nonCLL-likeclone.¥Thesamecaseatbaselineandfollow-up.*Otherthant(11;14).CLL:chroniclymphocyticleukemia;MBLlo:low- count monoclonal B-cell lymphocytosis; N: number; NA: not applicable; NS: not statistically significantly different (P>0.05).
haematologica | 2018; 103(7)
1203
