
Page 124 - Haematologica July
P. 124
I. Criado et al.
Clinical and biological characteristics of CLL-like MBLlo at baseline vs. follow-up, according to the kinet- ics of the B-cell clone
Upon comparing CLL-like MBLlo cases with increased vs. stable/decreased clonal B-cell numbers at seven years follow-up, the former had a similar male/female distribu- tion, but they were significantly younger (median age: 68y vs. 78y; Table 4).
Strikingly, MBLlo cases who showed larger CLL-like clone sizes over time also showed significantly higher (P<0.05) numbers of the distinct normal residual T-, B- and NK-cell subsets at follow-up (vs. baseline) (Table 4). Moreover, in these subjects a direct correlation was observed between the absolute number of clonal B cells and CD4+CD8– T cells (r2=0.5; P=0.001). In contrast, no significant (P>0.05) association was found between higher numbers of clonal CLL-like B cells in PB over time, and an increased frequency of cytogenetic alterations. Interestingly, del(13q14) was the sole genetic alteration detected at the seven year follow-up within cases with stable/decreased CLL-like B-cell clones, while those cases with increased CLL-like B-cell clones at year +7 showed cytogenetic alterations other than del(13q14), e.g., trisomy 12 (1/40), del(17p)(TP53) (1/39) and t(14q32) (5/20 cases tested) (Table 4).
A
Clinical outcome of MBLlo cases
Three subjects developed absolute lymphocytosis after seven years of follow-up (median: 5.3x10⁹ lymphocytes/L; range: 4.1x10⁹-5.9x10⁹/L) in the absence of signs of dis- ease. Two had CLL-like B-cell clones carrying del(13q14), while the remaining case had a non CLL-like clone. In one of the two CLL-like MBLlo cases, the size of the B-cell clone increased over the threshold for MBLhi (>500 clonal B cells/mL), while the other two cases remained as MBLlo. Remarkably, these three subjects displayed the highest increase in clone size at re-evaluation: this translated into a significantly lower (estimated) time to progression into CLL (median: 95y; range: 54-128y) according to the pre- dictive mathematical model used. In turn, the estimated time to progression to CLL for the other MBLlo individuals was far beyond a normal life expectancy (median: 54,767y; range: 54->63 million years).
Overall survival of MBL vs. non-MBL individuals
At the end of the study (January 2017), the clinical records and epidemiological questionnaires from all individuals recruited at baseline were reviewed. During follow-up, 21/89 (24%) MBLlo cases and 41/290 (14%) age- and sex- matched non-MBLlo subjects from the original cohort had died (P=0.03). Though the median OS for the two groups
1202
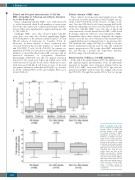
B
Figure 1. Changes in the num- ber of clonal B cells during fol- low-up. Panel A shows the absolute number of PB clonal B cells/mL detected in MBLlo individuals at baseline and at follow-up, according to the phe- notype of the clonal population. Panel B represents the fold- change in the number of clonal B cells/mL from baseline, which is represented by the horizontal light gray box. Notched boxes represent 25th and 75th per- centile values; the lines in the middle correspond to median values (50th percentile) and ver- tical lines represent the highest and lowest values that are nei- ther outliers nor extreme values, which are represented as single dots. ***P-value <0.001. N: number; CLL: chronic lymphocyt- ic leukemia.
haematologica | 2018; 103(7)
