
Page 140 - Haematologica June
P. 140
S. Grgurevic et al.
These include the β isoform of the tumor suppressor TP53 β and the LIG4 gene coding for a protein required in dou- ble-stranded break repair through the non-homologous end joining pathway, which were up-regulated by the MEC-2 subclone, along with MCM10 and GINS4, coding for fac- tors implicated in initiation of replication and POLH, a translesion synthesis DNA polymerase gene, which were slightly down-regulated (less than 2-fold) in the MEC-2 sub- clone. Strikingly, with more than a 5-fold higher expression level in the aggressive MEC-2 subclone, POLN was the gene we found to be most deregulated between the two CLL cell lines (Figure 3). These results suggest that POLN could be an advantageous trait for the CLL clone and could be selected during the evolution of the disease.
Relatively higher POLN expression contributes to fludarabine chemoresistance
We next evaluated the sensitivity of the MEC-1 and MEC-2 cell lines in the presence of fludarabine. Cells were
treated with different doses of the nucleoside analog for 24 h and cellular viability was measured at the end of the treat- ment period. MTS data analysis showed that the MEC-2 cell line was more chemoresistant than the MEC-1 cell line, as indicated by higher cellular viability and fludarabine EC50 values (239.2±2.16 mM for MEC-1 and 433.3±2.38 mM for MEC-2) (Figure 4A).
In order to gain deeper insight into the molecular mecha- nism by which MEC-2 cells maintained higher survival than MEC-1 in the presence of fludarabine, we next evalu- ated DNA replication efficiency in these two cell lines upon 2 hours (h) of treatment with fludarabine at the doses of 180 mM and 600 mM. The nucleoside analog EdU was added at the end of the treatment to visualize DNA synthe- sis and cells were stained with propidium iodide. When normalized to untreated conditions, flow cytometry cell cycle analysis showed a higher percentage of EdU-positive cells among the chemoresistant MEC-2 cells (Figure 4B and Online Supplementary Figures S3 and S4), suggesting that
Table 2. Multivariate analysis of time to progression by Cox proportional hazard models.
POLN
IGHV status Gender BINET stage
Parameter
High expression Low expression
Unmutated
Mutated
Male Female
C
B
Number
90 9
56
43
69 30
21
Hazard Ratio (HR)
4.14
1 (base)
2.04
1 (base)
2.11
1 (base)
1.61
95% HR Confidence limits
1.60-10.72
1.02-4.12
0.92-4.83
0.76-3.42
P
0.003
0.045
0.078
0.214
1042
78 1(base)
AB
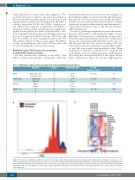
Figure 2. Proliferation and 3R gene expression profiles of primary sample from patients with chronic lymphocytic leukemia (CLL). Peripheral mononuclear cells from CLL patients were cultured in vitro in the absence or presence of proliferation stimuli (interleukin-2/DSP30) for six days. (A) CFSE-labeled unstimulated/non- proliferating and stimulated/proliferating primary CLL lymphocytes. (B) Unsupervised clustering according to 3R gene expression in non-proliferating and proliferating purified CLL cells. Out of 82 3R genes, only one gene was up-regulated upon proliferation (POLN), 10 genes were down-regulated and the other 71 genes remained stably expressed.
haematologica | 2018; 103(6)
