
Page 139 - Haematologica June
P. 139
BC
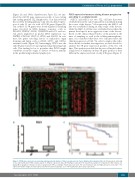
Figure 1. POLN gene expression as an independent prognostic marker of time to progression in chronic lymphocytic leukemia (CLL). (A) Unsupervised clustering of CLL and healthy donor (HD) samples based on 3R gene expression data. (B) POLN gene expression in CLL primary samples in comparison to HD samples. (C) Kaplan-Meier graphical estimates of time to progression (TTP) according to POLN expression level. The cut-off between low and high expression is 11.9x10⁻². The expression number ranges in under-expressed and over-expressed groups are 0.008-0.118 and 0.119-0.272, respectively.
Contribution of Pol nu in CLL progression
(Figure 2A and Online Supplementary Figure S2), we ana- lyzed the full 3R gene expression profile of non-cycling and cycling purified CLL lymphocytes. Our data revealed that actively dividing primary CLL cells modified expres- sion of only 11 out of a total of 82 3R genes (Figure 2B). Ten of these 11 3R genes were down-regulated, including genes involved in DNA damage response, such as FANCD2, PRKDC, SIN3B, TIMELESS and LIG3, and sev- eral genes implicated in global DNA replication, e.g. SHPRH, CDC25B, CHTF18, POLE and MCM9. In con- trast, the genes encoding factors of replication origin licensing and firing, such as CDC6, CDT1, and GINS4, remained stable (Figure 2B). Interestingly, POLN was the only 3R gene found to be up-regulated in proliferating CLL cells. This finding led us to postulate that POLN might contribute, from the origin, to disease evolution, namely, in the proliferating leukemic lymphocyte.
A
POLN expression increases during disease progression according to a cellular model
MEC-1 and MEC-2 are two CLL cell lines that were established from the same CLL patient sequentially during the course of the disease.19 More precisely, the MEC-1 cell line was established during an early stage of the disease, while the MEC-2 cell line was established later when the patient developed a more aggressive form of the disease. Based on the clinical characteristics of the patient at the time of sampling, as well as the cellular immunopheno- type, it is considered that these two cell lines reflect the clinical progression of CLL.20 In order to employ this cellu- lar model in our further investigations, we first decided to analyze the 3R gene expression profiles of the two cell lines. This analysis revealed that the two cell models share a high level of similarity in their 3R gene profiles as they differ in the expression levels of only 6 3R genes (Figure 3).
haematologica | 2018; 103(6)
1041
