
Page 269 - Haematologica Vol. 107 - September 2022
P. 269
LETTER TO THE EDITOR
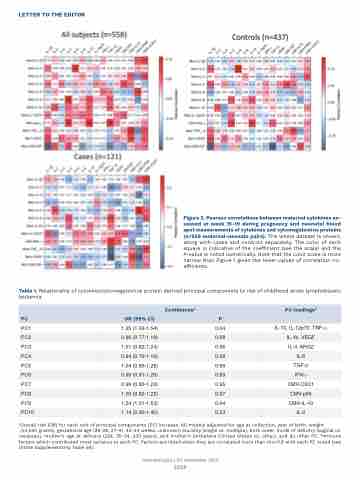
Figure 2. Pearson correlations between maternal cytokines as- sessed at week 15-19 during pregnancy and neonatal blood spot measurements of cytokines and cytomegalovirus proteins (n=558 maternal-neonate pairs). The whole dataset is shown, along with cases and controls separately. The color of each square is indicative of the coefficient (see the scale) and the P-value is noted numerically. Note that the color scale is more narrow than Figure 1 given the lower values of correlation co- efficients.
Table 1. Relationship of cytokine/cytomegalovirus protein derived principal components to risk of childhood acute lymphoblastic leukemia.
Continuousa
PC loadingsb
PC
OR (95% CI)
P
PC1
1.25 (1.02-1.54)
0.04
IL-10, IL-12p70, TNF-a
PC2
0.96 (0.77-1.18)
0.68
IL-1b, VEGF
PC3
1.01 (0.82-1.24)
0.96
IL-4, ARG2
PC4
0.94 (0.76-1.16)
0.58
IL-6
PC5
1.04 (0.85-1.28)
0.69
TGF-b
PC6
0.99 (0.81-1.20)
0.89
IFN-γ
PC7
0.99 (0.80-1.23)
0.95
CMV-CXC1
PC8
1.00 (0.82-1.22)
0.97
CMV-p65
PC9
1.24 (1.01-1.53)
0.04
CMV-IL-10
PC10
1.14 (0.92-1.40)
0.23
IL-2
aOverall risk (OR) for each unit of principal components (PC) increase. All models adjusted for age at collection, year of birth, weight (≥3,500 grams), gestational age (26-26, 27-41, 42-44 weeks, unknown) plurality (single vs. multiple), birth order, mode of delivery (vaginal vs. cesarean), mother’s age at delivery (≤24, 25-34, ≥35 years), and mother’s birthplace (United States vs. other), and all other PC. bImmune factors which contributed most variance to each PC. Factors are listed when they are correlated more than rho=0.6 with each PC noted (see
Online Supplementarty Table S4).
Haematologica | 107 September 2022
2268
