
Page 126 - Haematologica Vol. 107 - September 2022
P. 126
ARTICLE - Effects of BT200 on VWF/FVIII in humans
K.D. Kovacevic et al.
the different kinetic profiles observed following IV or SC administration.
The effect of BT200 on VWF:RCo appeared to be less pronounced when compared to that on free VWF A1-do- mains. For example, the 36 mg dose reduced median VWF:RCo from 108% to 30% (Online Supplementary Fig- ure S7), but median free VWF A1-domains from 84% to 6% after 48 h (both P<0.001; Friedman ANOVA). This ap- parent discrepancy reflects the 2-fold increase in circu- lating VWF antigen levels after 48 h, and because VWF:RCo is sensitive to changes in VWF levels, the ef- fects of BT200 were less pronounced in VWF:RCo when compared to the free VWF A1-domains. Circulating VWF antigen mass increased as early as 24 h after the start
of the IV infusion, and reached levels 4-fold higher than baseline between 7-14 days after SC doses of 24-48 mg (P<0.001) (Figure 3). VWF antigen levels increased 4-fold following multiple SC maintenance doses of 12 mg BT200 (P<0.001) (Figure 4).
As VWF is the carrier for FVIII, there was a corresponding 3- to 4-fold increase in FVIII activity levels 7 days after SC administration of 24-48 mg BT200 (P<0.001) (Figure 5). Multivariate analysis showed that the FVIII levels not only correlated with the dose, but also with baseline VWF antigen levels (multiple r2 values ranging from 0.66- 0.78 from 48 h to 21 days; P<0.001). Whereas a minimal increase of FVIII activity was observed following SC in- jection of BT200 at lower dose levels (0.18, 0.6, 1.8 mg),
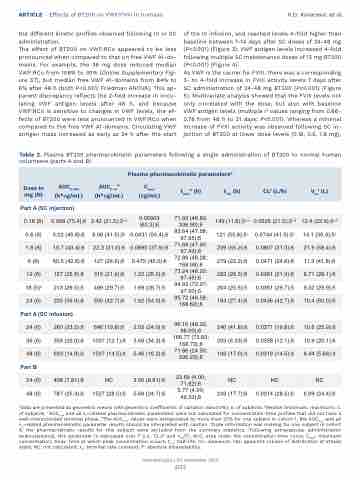
Table 2. Plasma BT200 pharmacokinetic parameters following a single administration of BT200 to normal human volunteers (parts A and B).
Plasma pharmacokinetic parametersa
Dose in mg (N)
AUC0-168 (h*mg/mL)
AUC d 0-∞
(h*mg/mL)
Cmax (mg/mL)
t b(h) max
t1/2 (h)
CLf (L/h)
Vssf (L)
Part A (SC injection)
0.18 (6)
0.968 (75.4);6
3.42 (21.5);3c,d
0.00903 (60.3);6
71.93 (46.83; 336.90);6
149 (11.8);3c,d
0.0526 (21.5);3c,d
12.4 (22.9);3c,d
0.6 (6)
5.02 (45.8);6
8.06 (41.5);5c
0.0431 (50.4);6
83.64 (47.58; 97.95);6
121 (55.8);5c
0.0744 (41.5);5c
14.1 (50.4);5c
1.8 (6)
10.7 (43.4);6
22.3 (31.0);6
0.0890 (37.9);6
71.68 (47.90; 97.43);6
239 (55.2);6
0.0807 (31.0);6
21.9 (58.4);6
6 (6)
60.5 (42.6);6
127 (24.6);6
0.475 (45.0);6
72.86 (48.28; 168.98);6
279 (22.2);6
0.0471 (24.6);6
11.3 (41.8);6
12 (6)
157 (25.6);6
315 (21.9);6
1.22 (25.0);6
73.24 (48.20; 97.45);6
263 (26.5);6
0.0381 (21.9);6
8.71 (28.1);6
18 (5)e
213 (29.5);5
499 (29.7);5
1.69 (28.7);5
94.93 (72.07; 97.50);5
204 (25.5);5
0.0361 (29.7);5
9.32 (29.9);5
24 (6)
235 (59.9);6
550 (42.7);6
1.92 (54.0);6
95.72 (48.58; 168.62);6
184 (27.4);6
0.0436 (42.7);6
10.4 (60.0);6
Part A (SC infusion)
24 (6)
260 (23.2);6
646 (19.8);6
2.03 (24.0);6
96.10 (48.22; 98.00);6
240 (41.8);6
0.0371 (19.8);6
10.6 (25.9);6
36 (6)
359 (22.0);6
1007 (12.1);6
3.09 (34.3);6
166.77 (72.83; 168.73);6
203 (6.53);6
0.0358 (12.1);6
10.9 (20.1);6
48 (6)
633 (14.8);6
1507 (14.5);4
5.46 (16.2);6
71.86 (24.50; 336.23);6
193 (17.0);4
0.0319 (14.5);4
8.44 (5.66);4
Part B
24 (6)
408 (7.81);6
NC
3.00 (8.61);6
23.69 (4.00; 71.82);6
NC
NC
NC
48 (6)
787 (25.4);6
1527 (28.5);6
5.69 (24.7);6
5.77 (4.00; 49.33);6
243 (17.7);6
0.0314 (28.5);6
6.99 (24.4);6
aData are presented as geometric means with geometric coefficients of variation (GeoCV%); n. of subjects. bMedian (minimum, maximum); n. of subjects. cAUC0-∞ and all λz-related pharmacokinetic parameters were not calculated for concentration-time profiles that did not have a well-characterized terminal phase. dThe AUC0-∞ values were extrapolated by more than 20% for one subject in cohort 1, the AUC0-∞ and all λz-related pharmacokinetic parameter results should be interpreted with caution. eDose information was missing for one subject in cohort 6: the pharmacokinetic results for this subject were excluded from the summary statistics. fFollowing extravascular administration (subcutaneous), this parameter is expressed over F (i.e., CL/F and Vss/F). AUC: area under the concentration-time curve; Cmax: maximum concentration; tmax: time at which peak concentration occurs; t1/2: half-life, CL: clearance; Vss: apparent volume of distribution at steady state; NC: not calculated; λz: terminal rate constant; F: absolute bioavailability.
Haematologica | 107 September 2022
2125
