
Page 66 - Haematologica May 2022
P. 66
G. Purgatorio et al.
Results
Variant identification and blood outgrowth endothelial cells characterization
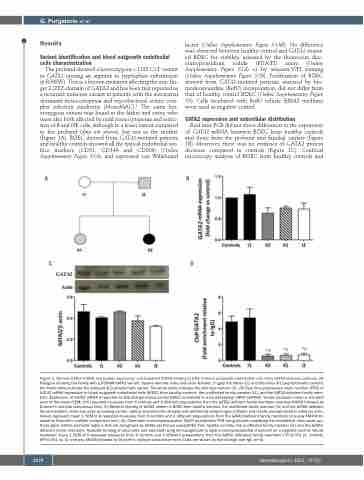
The proband showed a heterozygous c.1192 C>T variant in GATA2 causing an arginine to tryptophan substitution (p.R398W). This is a known mutation affecting the zinc fin- ger 2 (ZF2) domain of GATA2 and has been first reported as a recurrent missense variant in patients with the autosomal dominant monocytopenia and mycobacterial avium com- plex infection syndrome (MonoMAC).4 The same het- erozygous variant was found in the father and sister, who were also both affected by mild monocytopenia and reduc- tion of B and NK cells, although to a lesser extent compared to the proband (data not shown), but not in the mother (Figure 1A). BOEC derived from GATA2-mutated patients and healthy controls showed all the typical endothelial sur- face markers (CD31, CD146 and CD309) (Online Supplementary Figure S1A), and expressed von Willebrand
factor (Online Supplementary Figure S1AB). No difference was observed between healthy control and GATA2-mutat- ed BOEC for viability, assessed by the fluorescein diac- etate/propidium iodide (FDA/PI) assay (Online Supplementary Figure S2A) or by annexin-V/PI staining (Online Supplementary Figure S2B). Proliferation of BOEC derived from GATA2-mutated patients, assessed by bro- modeoxyuridine (BrdU) incorporation, did not differ from that of healthy control BOEC (Online Supplementary Figure S3). Cells incubated with BrdU vehicle (EBM2 medium) were used as negative control.
GATA2 expression and subcellular distribution
Real time PCR did not show differences in the expression of GATA2 mRNA between BOEC from healthy controls and those from the proband and familial carriers (Figure 1B). Moreover, there was no evidence of GATA2 protein decrease compared to controls (Figure 1C). Confocal microscopy analysis of BOEC from healthy controls and
AB
CD
Figure 1. Normal GATA2 mRNA and protein expression and impaired GATA2 binding to DNA in blood outgrowth endothelial cells from GATA2-deficient patients. (A) Pedigree showing the family with p.R398W GATA2 variant. Square denotes male and circle females. In gray the father (I2) and the sister (II1) asymptomatic carriers; the black circle indicates the proband (II2) symptomatic carrier. The white circle indicates the wild type mother (I1). (B) Real time polymerase chain reaction (PCR) of GATA2 mRNA expression in blood outgrowth endothelial cells (BOEC) from healthy controls, the unaffected family member (I1), and the GATA2-deficient family mem- bers. Expression of GATA2 mRNA is reported as fold change versus control BOEC normalized to a housekeeping mRNA (GAPDH). Values represent mean ± standard error of the mean (SEM) of 6 repeated measures from 6 controls and 3 different preparations from the GATA2-deficient family members (one-way ANOVA followed by Dunnett’s multiple comparison test). (C) Western blotting of GATA2 protein in BOEC from healthy controls, the unaffected family member (I1) and the GATA2-deficient family members. Actin was used as loading control. Optical densitometric analysis was performed using ImageJ software and results are expressed in arbitrary units. Values represent mean ± SEM of 8 repeated measures from 6 controls and 3 different preparations from the GATA2-deficient family members (one-way ANOVA fol- lowed by Dunnett’s multiple comparison test). (D) Chromatin immunoprecipitation (ChiP) quantitative PCR using primers amplifying the endothelial nitric oxide syn- thase gene (eNOS) promoter regions that are recognized by GATA2 performed using BOEC from healthy controls, the unaffected family member (I1) and the GATA2- deficient family members. Aspecific binding of chromatin was excluded using immunoglobulin G (IgG)-immunoprecipitated chromatin as a negative control. Values represent mean ± SEM of 6 repeated measures from 6 controls and 3 different preparations from the GATA2 deficiency family members (*P<0.001 vs. controls, #P<0.001 vs. I1; one-way ANOVA followed by Dunnett’s multiple comparison test). Data are shown as fold change over IgG (n=3).
1074
haematologica | 2022; 107(5)
