
Page 191 - Haematologica May 2022
P. 191
Letters to the Editor
ABC
DEF
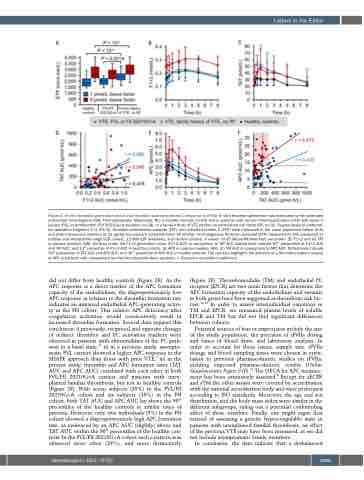
Figure 2. In vitro thrombin generation and in vivo thrombin-activated protein C response to rFVIIa. In vitro thrombin generation was measured by the calibrated automated thrombogram (CAT, Thrombinoscope, Maastricht, NL) in healthy controls (n=30) and in patients with venous thromboembolism (VTE) with factor V Leiden (FVL) or prothrombin (FII) 20210G>A mutation (n=28), or a family history of VTE without an established risk factor (RF, n=23). Plasma levels of prothrom- bin activation fragment 1+2 (F1+2), thrombin-antithrombin complex (TAT), and activated protein C (APC) were measured in the same population before (t=0) and after intravenous injection of 15 μg/kg recombinant activated factor VII (rFVIIa). (A) Endogenous thrombin potential (ETP) measured by CAT, presented as median and interquartile range (IQR, boxes), 1.5-fold IQR (whiskers), and outliers (circles). P-values <0.05 (Mann-Whitney test) are shown. (B) F1+2 and (C) TAT in plasma (median, IQR). (D) Area under the F1+2 generation curve (F1+2 AUC) in comparison to TAT AUC. Dotted lines indicate 90th percentiles of F1+2 AUC and TAT AUC, and 10th percentile of F1+2 AUC in healthy controls. (E) APC in plasma (median, IQR). (F) TAT AUC in comparison to APC AUC. Dotted lines indicate 90th percentiles of TAT AUC and APC AUC, and 10th percentile of APC AUC in healthy controls. The red area highlights the absence of a thrombin-related increase of APC in patients with unexplained familial thrombophilia (blue symbols). r: Pearson’s correlation coefficient.
did not differ from healthy controls (Figure 2E). As the APC response is a direct marker of the APC formation capacity of the endothelium, the disproportionately low APC response in relation to the thrombin formation rate indicates an impaired endothelial APC-generating activi- ty in the FH cohort. This relative APC deficiency after coagulation activation would consecutively result in increased thrombin formation. Several data support this conclusion: i) previously, reciprocal and opposite changes of indirect thrombin and PC activation markers were observed in patients with abnormalities of the PC path- way in a basal state;11 ii) in a previous study, asympto- matic FVL carriers showed a higher APC response in the SHAPE approach than those with prior VTE;7 iii) in the present study, thrombin and APC formation rates (TAT AUC and APC AUC) correlated with each other in both FVL/FII 20210G>A carriers and patients with unex- plained familial thrombosis, but not in healthy controls (Figure 2F). With seven subjects (25%) in the FVL/FII 20210G>A cohort and six subjects (26%) in the FH cohort, both TAT AUC and APC AUC lay above the 90th percentiles of the healthy controls in similar rates of patients. However, only two individuals (9%) in the FH cohort showed a disproportionately high APC formation rate, as evidenced by an APC AUC (slightly) above and TAT AUC within the 90th percentiles of the healthy con- trols. In the FVL/FII 20210G>A cohort such a pattern was observed more often (29%), and more distinctively
(Figure 2F). Thrombomodulin (TM) and endothelial PC receptor (EPCR) are two main factors that determine the APC formation capacity of the endothelium and variants in both genes have been suggested as thrombotic risk fac- tors.12,13 In order to assess interindividual variations in TM and EPCR, we measured plasma levels of soluble EPCR and TM but did not find significant differences between cohorts.
Potential sources of bias or imprecision include the size of the study population, the precision of rFVIIa dosing and times of blood draw, and laboratory analysis. In order to account for these issues, sample size, rFVIIa dosage and blood sampling times were chosen in orien- tation to previous pharmacokinetic studies on rFVIIa, yielding expected pharmacokinetic results (Online Supplementary Figure S1F).14 The OECA for APC measure- ment has been extensively assessed.8 Except for sECPR and sTM the other assays were covered by accreditation with the national accreditation body and were performed according to ISO standards. Moreover, the age and sex distribution, and the body mass index were similar in the different subgroups, ruling out a potential confounding effect of these variables. Finally, one might argue that instead of assessing a genetic hypercoagulable state in patients with unexplained familial thrombosis, an effect of the previous VTE may have been measured, as we did not include asymptomatic family members.
In conclusion, the data indicate that a dysbalanced
haematologica | 2022; 107(5)
1199
