
Page 190 - Haematologica May 2022
P. 190
Letters to the Editor
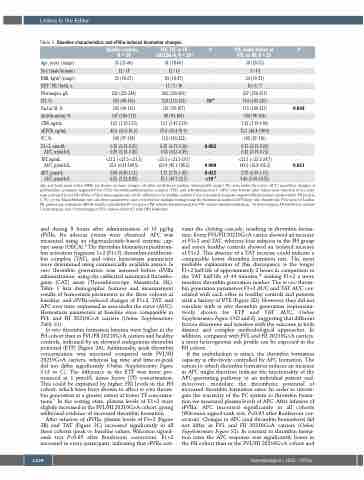
Table 1. Baseline characteristics and rFVIIa-induced biomarker changes.
Healthy controls, VTE, FVL or FII P VTE, family history of P N=30 20210G>A,N=28* VTE,noRF,N=23
Age, years (range) 35 (21-60) 41 (18-60) - Sex(male/female) 12/18 12/16 - BMI, kg/m2 (range) 23 (18-27) 24 (18-27) - DVT/PE/both,n - 15/3/10 -
38 (20-53) - 9/14 - 24 (19-27) - 10/6/7 - 267 (256-331) - 114 (103-120) -
Fibrinogen, g/L FII, %
Factor XI, % Antithrombin, % sTM, ng/mL sEPCR, ng/mL PC, %
F1+2, nmol/L AUC, nmol·h/L
TAT, ng/mL AUC, pmol·h/L
APC, pmol/L AUC, pmol·h/L
252 (221-284)
103 (98-116)
102 (90-115)
107 (100-111)
1.62 (1.30-2.15)
45.6 (26.0-81.6)
106 (97-118)
0.16 (0.12-0.21) 0.29 (0.16-0.45)
<21.2 (<21.3-<21.3) 35.9 (0.81-109.5)
0.68 (0.40-1.11)
6.55 (5.22-8.82)
262 (250-309) - 124 (115-135) 10-5
101 (95-107) - 98 (93-104) - 1.61 (1.47-2.19) - 57.0 (35.4-91.0) - 112 (103-122) -
0.25 (0.17-0.30) 0.002 0.34 (0.23-0.49) -
<21.3 (<21.3-29.7) - 123.9 (45.1-188.2) 0.008
1.13 (0.75-1.43) 0.022
15.1 (10.7-22.7) <10-4
115 (100-127)
100 (98-106) -
1.62 (1.19-1.86) -
72.5 (46,4-108.0) -
105 (97-116) -
0.15 (0.12-0.20) - 0.42 (0.19-0.73) -
<21.3 (<21.3-24.7) -
0.044
141.6 (12.8-332.3)
0.021
0.79 (0.39-1.11) - 9.46 (5.50-14.55) -
Age and body mass index (BMI) are shown as mean (range),all other variables as median (interquartile range).The area under the curve (AUC) quantifies changes of prothrombin activation fragment F1+2 (F1+2), thrombin-antithrombin complex (TAT), and activated protein C (APC) over 8 hours after intravenous injection of recombi- nant activated factorVII (rFVIIa).P describes significant (<0.05) differences to healthy controls.P was calculated using the unpaired Student t-test (prothrombin,FII;protein C, PC) or the Mann-Whitney test (all other parameters) and corrected for multiple testing using the Bonferroni method. DVT: deep vein thrombosis; FVL: factor V Leiden; PE: pulmonary embolism; sEPCR: soluble endothelial PC receptor; sTM: soluble thrombomodulin;VTE: venous thromboembolism. *14 heterozygous FII 20210G>A carriers, 1 homozygous and 13 heterozygous FVL carriers, thereof 2 with HR2 haplotype..
and during 8 hours after administration of 15 μg/kg rFVIIa. No adverse events were observed. APC was measured using an oligonucleotide-based enzyme cap- ture assay (OECA).8 The thrombin biomarkers prothrom- bin activation fragment 1+2 (F1+2), thrombin-antithrom- bin complex (TAT), and other hemostasis parameters were determined using commercially available assays. In vitro thrombin generation was assessed before rFVIIa administration, using the calibrated automated thrombo- gram (CAT) assay (Thrombinoscope, Maastricht, NL). Table 1 lists demographic features and measurement results of hemostasis parameters in the three cohorts at baseline, and rFVIIa-induced changes of F1+2, TAT, and APC over time, expressed as area under the curve (AUC). Hemostasis parameters at baseline were comparable in FVL and FII 20210G>A carriers (Online Supplementary Table S1).
In vitro thrombin formation kinetics were higher in the FH cohort than in FVL/FII 20210G>A carriers and healthy controls, indicated by an elevated endogenous thrombin potential (ETP) (Figure 2A), Additionally, peak thrombin concentration was increased compared with FVL/FII 20210G>A carriers, whereas lag time and time-to-peak did not differ significantly (Online Supplementary Figure S1A to C). The difference in the ETP was more pro- nounced at 1 pmol/L tissue factor (TF) concentration. This could be explained by higher FXI levels in the FH cohort, which have been shown to affect in vitro throm- bin generation at a greater extent at lower TF concentra- tions.9 In the resting state, plasma levels of F1+2 were slightly increased in the FVL/FII 20210G>A cohort, giving additional evidence of increased thrombin formation.
After infusion of rFVIIa, plasma levels of F1+2 (Figure 2B) and TAT (Figure 2C) increased significantly in all three cohorts (peak vs. baseline values, Wilcoxon signed- rank test P<0.05 after Bonferroni correction). F1+2 increased in every participant, indicating that rFVIIa acti-
vates the clotting cascade, resulting in thrombin forma- tion. Every FVL/FII 20210G>A carrier showed an increase of F1+2 and TAT, whereas four subjects in the FH group and seven healthy controls showed an isolated increase of F1+2. This absence of a TAT increase could indicate a comparably lower thrombin formation rate. The most probable explanation of this discrepancy is the longer F1+2 half-life of approximately 2 hours in comparison to the TAT half-life of 44 minutes,10 making F1+2 a more sensitive thrombin generation marker. The in vivo throm- bin generation parameters F1+2 AUC and TAT AUC cor- related with each other in healthy controls and patients with a history of VTE (Figure 2D). However, they did not correlate with in vitro thrombin generation (representa- tively shown for ETP and TAT AUC, Online Supplementary Figure S1D and E), suggesting that different factors determine and interfere with the outcome in both distinct and complex methodological approaches. In addition, compared with FVL and FII 20210G>A carriers, a more heterogenous risk profile can be expected in the FH cohort.
If the endothelium is intact, the thrombin formation capacity is effectively controlled by APC formation. The extent to which thrombin formation induces an increase in APC might therefore indicate the functionality of the APC-generating pathway in an individual patient and, moreover, modulate the thrombotic potential of increased thrombin formation rates. In order to investi- gate the reactivity of the PC system to thrombin forma- tion we measured plasma levels of APC. After infusion of rFVIIa, APC increased significantly in all cohorts (Wilcoxon signed-rank test, P<0.05 after Bonferroni cor- rection). Changes in APC (and thrombin biomarkers) did not differ in FVL and FII 20210G>A carriers (Online Supplementary Figure S2). In contrast to thrombin forma- tion rates the APC response was significantly lower in the FH cohort than in the FVL/FII 20210G>A cohort and
1198
haematologica | 2022; 107(5)
