
Page 179 - Haematologica May 2022
P. 179
Letters to the Editor
nearly all subjects. Median HL were greater in the high- intensity than standard-intensity groups across all phas- es, with the differences being statistically significant for all phases (P<0.01) except delayed intensification and maintenance.
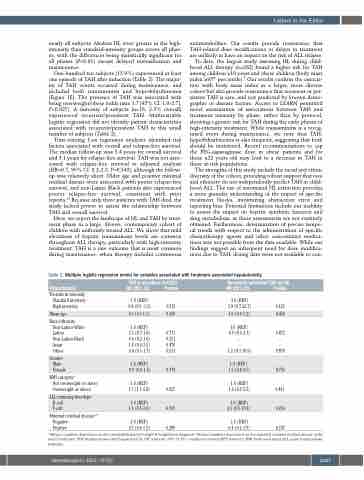
One hundred ten subjects (15.9%) experienced at least one episode of TAH after induction (Table 2). The major- ity of TAH events occurred during maintenance, and included both transaminitis and hyperbilirubinemia (Figure 1E). The presence of TAH was associated with being overweight/obese (odds ratio 1.7 [95% CI: 1.0-2.7], P=0.027). A minority of subjects (n=16, 2.3% overall) experienced recurrent/persistent TAH. Multivariable logistic regression did not identify patient characteristics associated with recurrent/persistent TAH in this small number of subjects (Table 2).
Time-varying Cox regression analyses identified risk factors associated with overall and relapse-free survival. The median follow-up was 3.4 years for overall survival and 3.1 years for relapse-free survival. TAH was not asso- ciated with relapse-free survival in adjusted analysis (HR=0.7, 95% CI: 0.2-2.3, P=0.543), although the follow- up was relatively short. Older age and positive minimal residual disease were associated with poorer relapse-free survival, and non-Latino Black patients also experienced poorer relapse-free survival, consistent with prior reports.14 Because only three patients with TAH died, the study lacked power to assess the relationship between TAH and overall survival.
Here, we report the landscape of HL and TAH by treat- ment phase in a large, diverse, contemporary cohort of children with uniformly treated ALL. We show that mild elevations of hepatic transaminase levels are common throughout ALL therapy, particularly with high-intensity treatment. TAH is a rare outcome that is most common during maintenance, when therapy includes continuous
antimetabolites. Our results provide reassurance that TAH-related dose modifications or delays in treatment are unlikely to have an impact on the risk of ALL relapse.
To date, the largest study assessing HL during child- hood ALL therapy (n=262) found a higher risk for TAH among children ≥10 years and obese children (body mass index ≥95th percentile).9 Our results confirm the associa- tion with body mass index in a larger, more diverse cohort but also provide reassurance that recurrent or per- sistent TAH is rare, and not predicted by known demo- graphic or disease factors. Access to LEARN permitted novel examination of associations between TAH and treatment intensity by phase, rather than by protocol, showing a greater risk for TAH during the early phases of high-intensity treatment. While transaminitis is a recog- nized event during maintenance, we note that TAH- hyperbilirubinemia is also frequent, suggesting that both should be monitored. Recent recommendations to cap the PEG-asparaginase dose in obese patients and for those ≥22 years old may lead to a decrease in TAH in these at-risk populations.
The strengths of this study include the racial and ethnic diversity of the cohort, providing robust support that race and ethnicity do not independently predict TAH in child- hood ALL. The use of automated HL extraction provides a more granular understanding of the impact of specific treatment blocks, minimizing abstraction error and reporting bias. Potential limitations include our inability to assess the impact on hepatic synthetic function and drug metabolism, as these assessments are not routinely obtained. Furthermore, determination of precise tempo- ral trends with respect to the administration of specific chemotherapy agents and other concomitant medica- tions was not possible from the data available. While our findings suggest an infrequent need for dose modifica- tions due to TAH, dosing data were not available to con-
Table 2. Multiple logistic regression model for variables associated with treatment-associated hepatotoxicity.
Characteristic
Treatment intensity Standard intensity High intensity
Mean age
Race/ethnicity Non-Latino-White Latino Non-Latino-Black Asian
Other
Gender Male
Female
BMI category*
Not overweight or obese Overweight or obese
ALL immunophenotype B-cell
T-cell
Minimal residual disease^ Negative
Positive
OR (95% CI)
1.0 (REF) 0.8 (0.5 -1.5)
1.0 (1.0-1.1)
1.0 (REF) 1.1 (0.7-1.8) 0.6 (0.2-1.6) 1.4 (0.6-3.5) 0.4 (0.1-1.7)
1.0 (REF) 0.9 (0.6-1.5)
1.0 (REF) 1.7 (1.1-2.8)
1.0 (REF) 1.2 (0.5-2.6)
1.0 (REF) 0.7 (0.4-1.3)
P-value 0.515
0.358
0.771 0.321 0.470 0.211
0.774
0.027
0.729
0.289
OR (95% CI)
1.0 (REF) 3.9 (0.7-22.7)
1.0 (0.9-1.2)
1.0 (REF) 0.9 (0.3-3.1) --
--
1.2 (0.1-10.5)
1.0 (REF) 1.2 (0.4-4.1)
1.0 (REF) 1.6 (0.5-5.5)
1.0 (REF) 2.3 (0.5-10.1)
1.0 (REF) 0.4 (0.1-1.9)
P-value 0.125
0.434
0.872 -- -- 0.878
0.755
0.461
0.253
0.237
TAH in any phase (n=110)
Recurrent/persistent TAH (n=16)
*Subject numbers dependent on documented/abstracted height & weight from diagnosis. ^Subject numbers dependent on documented minimal residual disease at the end of induction.TAH: treatment-associated hepatotoxicity; OR: odds ratio; 95% CI: 95% confidence interval; REF: reference; BMI: body mass index; ALL: acute lymphoblastic leukemia.
haematologica | 2022; 107(5)
1187
