
Page 159 - Haematologica May 2022
P. 159
Acquired ibrutinib resistance in WM
A
B
ing T0. Bridging ibrutinib with salvage therapy was well tolerated, and no unexpected toxicities were observed.
Survival outcomes
The median follow-up from T0 was 13 months (range, 0.2-75 months) for the entire cohort, and 20 patients (39%) had died at the time of this report. The median OS from T0 was 51 months (95% CI: 15.3-not reached [NR]), and the 5- year OS was 44% (95% CI: 26-75) (Figure 3A). The median OS for the patients who received at least one salvage regi- men after T0 was 51 months (95% CI: 21-NR). Patients who did not receive any salvage therapy following T0 (n=3) had a median OS of 0.4 months (95% CI: 0.20-NR), with survival times of 0.2, 0.8, and 0.4 months, respectively. The median OS from WM diagnosis for the entire cohort was 20.4 years (95% CI: 13.2-NR; Online Supplementary Figure S2).
The prognostic factors identified in a univariate analy- sis that impact OS after T0 are shown in Table 4. Only the types of previous therapy received before T0 significantly impacted OS (P=0.018; Figure 3B). Quadruple-class (ritux- imab, proteasome inhibitor, alkylator, ibrutinib) exposed disease was significantly associated with a shorter OS fol- lowing T0 (HR 8.08, 95% CI: 1.05-6.21; P=0.04). Among patients without quadruple-class exposed disease, there was no significant difference in OS between the different types of previous therapy (P=0.57). Patients with and without quadruple-class exposed disease had a median OS following T0 of 13.2 months and NR, respectively (P<0.001; Online Supplementary Figure S3). The 5-year OS for patients without quadruple-class exposed disease was 62% (95% CI: 38-98).
OS was impacted by the attainment and depth of response to the first salvage regimen after T0. The median OS was significantly longer among patients who achieved a response to the first salvage regimen versus those patients who did not (NR vs. 10.8 months; 95% CI: 0.01- 0.27; P<0.0001; Figure 3C). When stratified by the depth
Table 4. Prognostic factors for overall survival at the time of ibrutinib discontinuation (T0).
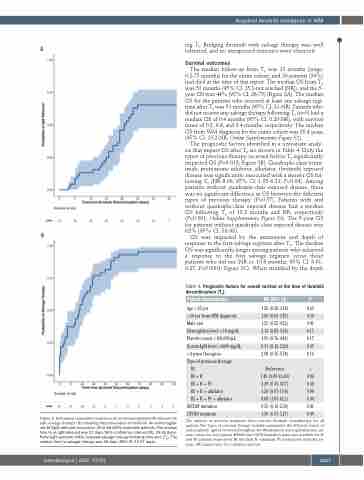
Figure 2. Estimated cumulative incidence of an immunoglobulin M rebound (A) and salvage therapy (B) following discontinuation of ibrutinib. An immunoglob- ulin M (IgM) rebound occurred in 29 of 48 (60%) evaluable patients. The median time to an IgM rebound was 27 days (95% confidence interval [CI]: 24-33 days). Forty-eight patients (94%) received salvage therapy following time-zero (T0). The median time to salvage therapy was 18 days (95% CI: 13-27 days).
Patient characteristic
Age >65 yrs.
>10 yrs from WM diagnosis Male sex
Hemoglobin level <10 mg/dL Platelet count <100,000/μL Serum IgM level >4000 mg/dL >4 prior therapies
Type of previous therapy
IB
IB + R
IB+R+PI
IB + R + alkylator IB+R+PI+alkylator
MYD88 mutation CXCR4 mutation
HR (95% CI) P
1.26 (0.50-3.18) 0.62 1.60 (0.66-3.87) 0.30 1.53 (0.55-4.22) 0.41 2.12 (0.85-5.26) 0.11 1.92 (0.76-4.81) 0.17 0.51 (0.12-2.20) 0.37 2.08 (0.75-5.78) 0.16
Reference -
1.45 (0.09-23.40) 0.80
3.29 (0.35-30.7) 0.30
1.20 (0.07-19.4) 0.90
8.08 (1.05-62.1) 0.04
0.55 (0.12-2.34) 0.41
1.36 (0.57-3.27) 0.49
The number of previous treatment lines includes ibrutinib monotherapy for all patients. The “types of previous therapy” variable summarizes the different classes of anti-neoplastic agents received throughout the Waldenström macroglobulinemia dis- ease course for each patient. MYD88 and CXCR4 mutation status was available for 46 and 40 patients, respectively. IB: ibrutinib; R: rituximab; PI: proteasome inhibitor, yrs: years; HR: hazard ratio; CI: confidence interval.
haematologica | 2022; 107(5)
1167
