
Page 118 - Haematologica May 2022
P. 118
J. Gao et al.
to these agents inevitably arises. Given that a recent study showed that ABC transporters mediate resistance to a THZ series of transcriptional CDK inhibitors,29,30 we next deter- mined the role of MDR1 in de novo and acquired THZ531 resistance. Although sensitive cells had IC50 values in the
nanomolar range, the de novo resistant line REC-1 had an IC50 of 1.63 μM (Figure 4A). Using the same functional bio- chemical and pharmacogenomic approaches as those used for the THZ531-sensitive lines, we investigated the molec- ular pathways and mechanisms responsible for resistance
AC
B
D
E
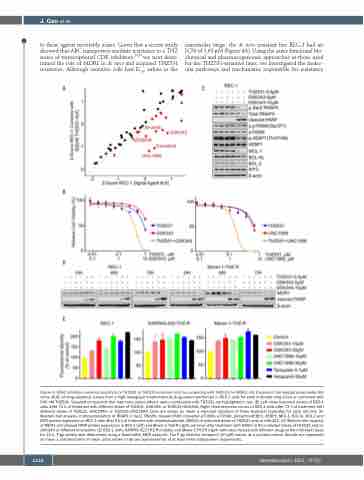
Figure 5. EZH2 inhibitors restored sensitivity to THZ531 in THZ531-resistant cells by competing with THZ531 for MDR1. (A). Z-scores of normalized areas under the curve (AUC) of drug response curves from a high-throughput small-molecule drug screen performed in REC-1 cells for each indicated drug alone or combined with 500 nM THZ531. Selected compounds that had more potent effects upon combination with THZ531 are highlighted in red. (B) Left: dose-response curves of REC-1 cells after 72 h of treatment with different doses of THZ531, GSK343, or THZ531+GSK343. Right: dose-response curves of REC-1 cells after 72 h of treatment with different doses of THZ531, UNC1999, or THZ531+UNC1999. Data are shown as mean ± standard deviation of three technical replicates for each cell line. (C) Western blot analysis of phosphorylation of RNAPII in Ser2, RNAPII, cleaved PARP, phosphor-p70S6K, p70S6K, phosphor-4EBP1, 4EBP1, MCL-1, BCL-XL, BCL-2 and MYC protein expression in REC-1 cells after 24 h of treatment with dimethylsulfoxide (DMSO) or indicated doses of THZ531 and/or GSK343. (D) Western blot analysis of MDR1 and cleaved PARP protein expression in REC-1 (left) and Maver-1-THZ-R (right) cell lines after treatment with DMSO or the indicated doses of THZ531 and/or GSK343 at different time points. (E) REC-1 (left), KARPAS-422-THZ-R (middle) and Maver-1-THZ-R (right) cells were treated with different drugs at the indicated doses for 12 h. P-gp activity was determined using a fluorimetric MDR assay kit. The P-gp inhibitor verapamil (30 μM) served as a positive control. Results are expressed as mean ± standard error of mean. Data shown in (B) are representative of at least three independent experiments.
1126
haematologica | 2022; 107(5)
