
Page 178 - 2022_03-Haematologica-web
P. 178
Letters to the Editor
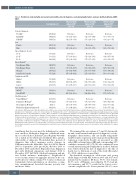
Table 2. Relation of early mortality and overall survival with period of diagnosis, sociodemographic factors and care facility, California, 2005- 2017.
Period of diagnosis Pre-ACA†
Early ACA‡
Full ACA&
Sex Female Male
Age at diagnosis (years) 15–20
21–25
26–39 Race/ethnicity*
Non-Hispanic White Non-Hispanic Black Hispanic Asian/Pacific Islander
Neighborhood SES Highest
Middle
Lowest
Care facility NCI-CC Non-NCI-CC
Health insurance* Private/Military&
Continuous Medicaid¥ Discontinuous Medicaid¶ Medicaid at diagnosis/uninsuredμ
N. of patients (%)
216 (41.2) 144 (27.5) 164 (31.3)
266 (50.8) 258 (49.2)
95 (18.1) 100 (19.1) 329 (62.8)
142 (27.1) 32 (6.1) 277 (52.9) 65 (12.4)
130 (24.8) 186 (35.5) 208 (39.7)
199 (38.0) 325 (62.0)
202 (38.6) 116 (22.1) 42 (8.0) 138 (26.3)
7-day mortality Adjusted OR§ (95% CI)
Reference 0.57 (0.27–1.23) 0.42 (0.18–0.98)
Reference 1.21 (0.64–2.30)
Reference 1.07 (0.39–2.90) 0.87 (0.38–1.98)
Reference 0.95 (0.18–4.99) 1.97 (0.82–4.74) 1.45 (0.43–4.92)
Reference 1.44 (0.54–3.87) 2.09 (0.78–5.60)
Reference 4.85 (1.96–12.0)
Reference 0.77 (0.29–2.07) 1.12 (0.35–3.57) 1.00 (0.44–2.29)
30-day mortality Adjusted OR§ (95% CI)
Reference 0.72 (0.36–1.44) 0.51 (0.24–1.08)
Reference 0.99 (0.55–1.78)
Reference 0.72 (0.28–1.83) 0.77 (0.37–1.63)
Reference 1.19 (0.28–4.98) 2.16 (0.95–4.94) 1.25 (0.38–4.10)
Reference 1.38 (0.55–3.46) 2.27 (0.91–5.66)
Reference 5.24 (2.26–12.2)
Reference 0.71 (0.29–1.76) 1.28 (0.46–3.61) 0.98 (0.46–2.10)
Overall survival Adjusted HR§ (95% CI)
Reference 0.60 (0.35–1.03) 0.39 (0.20–0.76)
Reference 1.25 (0.78–1.98)
Reference 0.94 (0.45–1.96) 0.93 (0.52–1.67)
Reference 1.27 (0.45–3.64) 1.56 (0.84–2.91) 1.40 (0.60–3.23)
Reference 1.04 (0.52–2.08) 1.69 (0.86–3.33)
Reference 3.71 (1.97–6.99)
Reference 0.86 (0.42–1.77) 1.52 (0.70–3.29) 1.04 (0.57–1.92)
OR: odds ratio; HR: hazard ratio; ACA: Affordable Care Act; SES: socioeconomic status; NCI-CC, National Cancer Institute-Designated Cancer Center. †Pre-ACA: March 2005 to September 2010, ‡Early ACA: October 2010 to December 2013; &Full ACA: 2014 to 2017 *Other/unknown race/ethnicity and other/unknown health insurance was omitted from the table due to the small number of events. Data on Hispanics14 and Asian/Pacific Islanders15 are derived from a combination of variables based on the North American Association of Central Cancer Registries. &Private insurance includes: Military, Health Maintenance Organization, Preferred Provider Organization, and Medicare. ¥Continuous Medicaid: enrollment 5 or 6 months prior to the diagnosis of acute prolmyelocytic leukemia. μMedicaid at diagnosis/uninsurance: coverage beginning in the month prior to or within 2 months after diagnosis to account for reactive enrollment. ¶Discontinuous Medicaid: enrollment that does not meet the definitions for continu- ous enrollees or Medicaid at diagnosis or Medicaid insurance recorded in the California Cancer Registry but without a match in the Medicaid enrollment files. §Multivariable logistic regression (for early mortality) and Cox proportional regression models (for overall survival) were adjusted for all variables in the table.The propor- tional hazard assumption, assessed by examining log-log survival plots and confirmed using Schoenfeld residuals, was met for all variables in the multivariate Cox regres- sion model.
(enrollment that does not meet the definitions for contin- uous enrollees, Medicaid at diagnosis or Medicaid insur- ance recorded in the California Cancer Registry but with- out a match in the Medicaid enrollment files), private, other public or unknown. We included three periods of diagnosis that reflect insurance policy changes in California under the Affordable Care Act (ACA): March 2005 to September 2010 (pre-ACA), October 2010 to December 2013 (early ACA: Dependent Care Expansion and early Medicaid expansion), and January 2014 to December 2017 (full ACA: Medicaid expansion and pri- vate health insurance marketplace). Neighborhood socioeconomic status is an aggregate measure at the cen- sus block level,5 which contains U.S. Census or American Community Survey information on education, occupa- tion, unemployment, household income, poverty, rent and house values.
We examined the associations of 7- and 30-day mortal- ity and overall survival with period of diagnosis, sociode- mographic characteristics, and care facility using multi- variable logistic regression and Cox proportional hazards regression, respectively. Results are presented as odds ratios (OR) or hazard ratios (HR) and corresponding 95% confidence intervals (95% CI). We also estimated 3-year overall survival using the Kaplan-Meier method. Patients were followed from the date of diagnosis to the date of death, loss to follow-up or end of the study (December 31, 2018), whichever occurred first.
Five-hundred twenty-four adolescents and young adults diagnosed with APL between 2005 and 2017 were included in the analyses. Of these, 50.8% were female, 52.9% were of Hispanic race/ethnicity, 38.6% had pri- vate insurance, and 39.7% resided in the lowest socioe- conomic neighborhoods. Fewer patients (38.0%) were
734
haematologica | 2022; 107(3)
