
Page 177 - 2022_03-Haematologica-web
P. 177
LETTERS TO THE EDITOR
Early mortality and survival improvements for adolescents and young adults with acute promyelocytic leukemia in California: an updated analysis
In the last two decades, survival from newly diagnosed acute promyelocytic leukemia (APL) has improved sub- stantially after the introduction of all-trans retinoic acid (ATRA) and arsenic trioxide (ATO).1 Nevertheless, recent population-based studies revealed that mortality within 30 days of diagnosis remained high despite greater awareness of APL-specific coagulopathy and guidelines recommending prompt initiation of ATRA and aggressive supportive care as soon as APL is suspected.2,3 We previ- ously showed that among patients aged ≤39 years diag- nosed with APL in California, 30-day mortality decreased from 26% before ATRA (1988-1995) to 14% after ATRA
(2004-2011).4 However, 7-day mortality did not differ between the pre- and post-ATRA eras. A higher risk of 30-day mortality and inferior overall survival were observed among patients without health insurance and those of Hispanic race/ethnicity. In this update, we exam- ined whether early mortality decreased in the most recent eras of treatment and also examined overall sur- vival trends among adolescents and young adults (15-39 years) with APL.
We used data from the California Cancer Registry linked to Medicaid enrollment files. Health insurance was classified based on Medicaid enrollment from 6 months prior to 6 months after APL diagnosis. The fol- lowing categories were created: continuous Medicaid (enrollment 5 or 6 months prior to APL diagnosis), unin- surance or Medicaid at diagnosis (enrollment begins in the month prior to or within 2 months after diagnosis to account for reactive enrollment), discontinuous Medicaid
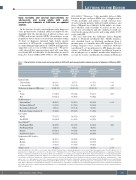
Table 1. Characteristics of adolescents and young adults (n=524) with acute promyelocytic leukemia by period of diagnosis, California, 2005- 2017.
Period of diagnosis
Early ACA‡
(2010–2013)
N=144
n(%) n(%) n(%)
P-valuea
0.011 0.029 0.567
0.458 <0.001
0.507 0.472
0.271 <0.001
Pre-ACA† (2005–2010) N=216
Full ACA& (2014–2017) N=164
Early mortality 7-day mortality 30-day mortality
Median age at diagnosis (IQR), years Sex
Female
Male
Health insurance*
Private/military&
Continuous Medicaid¥ Discontinuous Medicaid¶ Medicaid at diagnosis/uninsuredμ
Care facility NCI-CC Non-NCI-CC
Race/ethnicity** Non-Hispanic White Non-Hispanic Black Hispanic Asian/Pacific Islander
Neighborhood SES (tertiles) Highest
Medium
Lowest
Total deceased
28 (13.0)
31 (14.4) 29 (22–35)
103 (47.7) 113 (52.3)
94 (43.5) 30 (13.9) 14 (6.5) 61 (28.2)
77 (35.7) 139 (64.4)
62 (28.7) 12 (5.6) 113 (52.3) 25 (11.6)
54 (25.0) 72 (33.3) 90 (41.7)
49 (22.7)
11 (7.6) 15 (10.4) 29 (23–35)
78 (54.2) 66 (45.8)
59 (41.0) 20 (13.9) 15 (10.4) 47 (32.6)
54 (37.5) 90 (62.5)
45 (31.3) 6 (4.2) 76 (52.8) 16 (11.1)
32 (22.2) 62 (43.1) 50 (34.7) 19 (13.2)
9.0 (5.5)
12 (7.3) 28 (23–33)
85 (52.0) 79 (48.2)
49 (29.9) 66 (40.2) 13 (7.9) 30 (18.3)
68 (41.5) 96 (58.5)
35 (21.3) 14 (8.5) 88 (53.7) 24 (14.6)
44 (26.8) 52 (31.7) 68 (41.5) 12 (7.3)
ACA: Affordable Care Act; SES: socioeconomic status; NCI-CC: National Cancer Institute-Designated Cancer Center; IQR: interquartile range. †Pre-ACA: March 2005 to September 2010; ‡Early ACA: October 2010 to December 2013; &Full ACA: 2014 to 2017. &Private insurance includes: Military, Health Maintenance Organization, Preferred Provider Organization, and Medicare. ¥Continuous Medicaid: enrollment 5 or 6 months prior to diagnosis. mMedicaid at diagnosis/uninsurance: coverage beginning in the month prior to or within 2 months after diagnosis to account for reactive enrollment. ¶Discontinuous Medicaid: enrollment that does not meet the definitions for continu- ous enrollees or Medicaid at diagnosis or Medicaid insurance recorded in the California Cancer Registry but without a match in the Medicaid enrollment files. *Other public (n=3, 0.6%) and unknown (n=23, 4.4%) insurances are not presented in the table. Other public insurance includes Indian/ Public Health Service, County Funded, not otherwise specified (NOS); Medicare without supplement; Medicare, NOS. **Other race/ethnicity (American Indian, n=4) and unknown (n=4) are not presented in the table. Data on Hispanics14 and Asian/Pacific Islanders15 are derived from a combination of variables based on the North American Association of Central Cancer Registries. ac2 P-values were used to compare frequency distributions of sociodemographic and clinical characteristics by treatment.Tests for trends were used to examine early mor- tality by treatment era.
haematologica | 2022; 107(3)
733
