
Page 168 - 2022_03-Haematologica-web
P. 168
K. Ponnusamy et al.
AB
CDE
FG
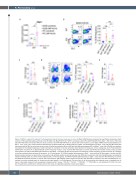
Figure 2. ZBP1 is required for optimal T cell-dependent humoral immune responses in mice. (A) Zbp1 mRNA levels as assessed by quantitative polymerase chain reaction in FACS-purified splenic germinal center B (GCB) cells (B220+CD19+GL7+CD95+) and plasma cells (PC) (B220loCD138+) from Zbp1-/- (KO) mice or their wild- type (WT) littermates immunized with just alum (control) or alum-NP-KLH (NP-KLH) on day 10 after immunization. Lack of Zbp1 mRNA confirms Zbp1-deficiency in Zbp1-/- mice. (n=3). (B, C) Flow-cytometric identification of splenic GCB cells as B220+CD19+GL7+CD95+ and GCB frequency in Zbp1-/- mice and their WT littermates immunized with NP-KLH or alum-only control on day 10 after immunization (B) and GCB cell fold-difference between WT and Zbp1-/- mice after NP-KLH immunization normalized to the median frequency of control animals (C). Numbers in the flow cytometry plots represent % frequency. (n=11 mice/group). (D, E) Flow-cytometric identification of splenic PC as B220loCD138+ and PC frequency in Zbp1-/- mice and their WT littermates in control and NP-KLH-immunized animals on day 10 after immunization (D) and PC fold-difference between WT and Zbp1-/- mice after NP-KLH immunization normalized to median frequency of control animals (E). Numbers in the flow cytometry plots represent % frequency (n=11 mice/group). (F) NP-KLH-specific IgG responses in Zbp1-/- mice and their WT littermates in control- and NP- KLH-immunized animals on day 10 after immunization. IgG antibody relative levels (left panels) after NP-KLH immunization and their fold-differences normalized to median antibody levels of control animals (right panels). (n=6 mice/group). (G) NP-KLH-specific IgM responses in Zbp1-/- mice and their WT littermates in control- and NP-KLH-immunized animals on day 10 after immunization. IgM antibody relative levels (left panels) after NP-KLH immunization and their fold-differences nor- malized to median antibody levels of control animals (right panels) (n=6 mice/group). The error bars of all the cumulative data indicate mean ± standard error of mean. A two-tailed unpaired t-test was applied to determine the P values. *P≤0.05, **P≤0.01, ***P≤0.001, ****P≤0.0001, ns- not significant (P>0.05). The num- ber of experiments performed or animals used for the study are indicated separately in each panel legend.
724
haematologica | 2022; 107(3)
