
Page 155 - 2022_03-Haematologica-web
P. 155
Deregulation of JAK2 signaling underlies pcAECyTCL
Figure 6. RNA sequencing supports upregulation of JAK2 signaling in pcAECyTCL. (A) Heat map showing 1,603 differentially expressed genes (1,076 upregulated, 527 downregulated, false discovery rate [FDR] <0.01) in pcAECyTCL when compared to skin-resident CD8+ T cells. (B) Gene set enrichment analysis (GSEA) uncov- ered upregulation of the JAK-STAT pathway, the cell cycle (E2F targets, G2/M checkpoint, mitotic spindle), the NF-κB pathway and high inflammatory response in pcAECyTCL. NES: normalized enrichment score; FDR q-value: false discovery rate q-value. (See the Online Supplementary Table S18 for a complete list of GSEA sig- natures) (C) Examination of differentially expressed genes involved in the JAK-STAT pathway revealed that JAK2 itself, enhancers of JAK2 signaling and components of cytokine receptors that signal predominantly via JAK2 are upregulated in primary cutaneous CD8+ aggressive epidermotropic cytotoxic T-cell lymphoma (pcAECyTCL). (D) Activation of the JAK-STAT pathway (via STAT3 and/or STAT5) in pcAECyTCL was confirmed by immunohistochemistry (IHC) on tumor tissue from sequenced patients (i.e., AEC1/3/5-10). Neoplastic cells exhibited activated STAT3 and/or STAT5 in the nucleus. Normal skin (control) displayed STAT3 activation in keratinocytes and endothelial cells as well as STAT5 activation in melanocytes and endothelial cells. Scale bar, 50 mm.
A
BC
Di Dii
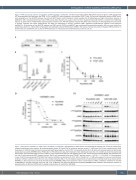
Figure 7. Oncogenicity validation of JAK2 fusions identified in pcAECyTCL. (A) Expression of JAK2 fusions in transduced Ba/F3 cells was verified by reverse tran- scriptase polymerase chain reaction. M: molecular-weight marker; B: Fusion DNA in backbone (positive control); F: cDNA from Ba/F3 cells transduced with JAK2 fusion gene; N: cDNA from Ba/F3 cells transduced with eGFP gene (negative control); NTC: non-template control (H2O). (B) Violin plots showing viability of Ba/F3 cells expressing fusion genes KHDRBS1-JAK2, PCM1-JAK2 or TFG-JAK2 seven days after interleukin-3 (IL3) withdrawal (mean OD, n=3). Viability of all cell lines expressing JAK2 fusions was noticeably higher (P<0.05, student’s t-test) compared to wild-type and negative control cells. Control samples: parental Ba/F3 cells (wild-type con- trol), Ba/F3 cells expressing eGFP (negative control), Ba/F3 cells expressing fusion gene TFG-MET (positive control). *P<0.05; ****P<0.0001. (C) Dose-response curves of Ba/F3 cells expressing PCM1-JAK2 (half maximal inhibitory concentration [IC50]=11 nM) or TFG-JAK2 (IC50 =9 nM) when exposed to various concentrations of JAK1/2 inhibitor ruxolitinib (mean OD; error bars, standard deviation [SD], n=3). (D) Validation experiments with JAK2 fusion containing novel kinase fusion partner KHDRBS1. (i) Dose-response curves of Ba/F3 cells expressing KHDRBS1-JAK2 when exposed to various concentrations of JAK1/2 inhibitors ruxolitinib (IC50=15 nM) or AZD1480 (IC50=40 nM) (mean OD; error bars, SD, n=3). (ii) Western blot analysis of Ba/F3 cells expressing KHDRBS1-JAK2 showed a dose-response reduction in phosphorylation of JAK2 and STAT5 with increasing concentrations of ruxolitinib or AZD1480.
haematologica | 2022; 107(3)
711
