
Page 101 - 2022_03-Haematologica-web
P. 101
Dendritic cells in myelodysplastic syndromes
0.23%). Using the IPSS and IPSS-R risk stratification, sim- ilar results were observed. Patients within higher risk groups showed lower frequencies of cDC (Figure 1D and E). Furthermore, MDS-derived paired BM and PB samples showed strong correlations for frequencies of designated subsets, except for cDC1 (Figure 1F).
In order to assess clonal involvement of isolated cDC2 and slan+ non-classical monocytes (due to limited cell availability cDC1 was not tested), three different MDS samples with a known cytogenetic aberration (del5q, tri- somy 8 and monosomy 7) were selected for FISH analysis. In all tested cases, cDC2 were highly involved in the dys- plastic clone. Due to the limited cell numbers of slan+ monocytes, a clear conclusion could only be drawn for the del5q analysis. In this patient slan+ monocytes were also highly involved in the dysplastic clone. As expected, CD34+ progenitor cells were also clonally involved where- as B cells were not (Figure 2).
Immunological gene sets related to danger response are under-represented in myelodysplastic syndrome-derived antigen presenting cells
analysis (GSEA) was executed. Twenty gene sets involved in immunological processes were selected from the Broad Institute database and tested for enrichment in either HD samples or MDS samples. For cDC2 5 gene sets were significantly enriched in HD (with a nominal P- value <0.01) and none of them was enriched in MDS. Slan+ monocytes showed five significantly enriched gene sets in HD and two in MDS (Figure 3D and E). For each cell subset an example enrichment plot is shown. Genes that contribute to the core enrichment for this specified gene set are displayed in a heatmap (67 genes for cDC2, 75 of 280 are shown for slan+ monocytes). For cDC2, a great part of these genes consisted of pattern recognition receptors, such as the toll-like receptors (TLR 1, 2, 3, 5, 7, 8 and 10), C-type lectin receptors (CLEC4A, E, C and CLEC6A) and CD180. For slan+ monocytes also Fc-γ receptors (FCGR1A, FCGR2A/B and FCGR3A) and
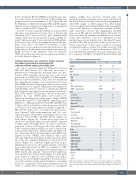
Table 1. Patient and control characteristics
Bone marrow
Peripheral blood
In order to screen for functional differences between HD- and MDS-derived cDC and slan+ monocytes a genome-wide transcriptional profiling study was per- formed. cDC2 and slan+ monocytes were sorted from previously stored HD (n=3) and MDS (n=4) BM samples. Because of low cell numbers, cDC1 were not included in this study. Patient samples were selected based on their 2016 WHO classification group in order to create a more homogenous set of samples. All patients were diagnosed with RS-MLD, were in very low to intermediate IPSS-R risk categories and, apart from one patient who had a 45,X,-Y [3] / 46,XY [7] karyotype, showed normal cyto- genetics. In total, 135.750 genes were found to be expressed (including non-coding genes). Using ANOVA testing the number of differentially expressing genes (DEG) for coding transcripts between HD and MDS was 1.922 for cDC2 and 2.415 for slan+ monocytes. In cDC2 1.075 genes were under-expressed in MDS compared to HD and 847 genes were over-expressed. Slan+ mono- cytes showed 1.655 under-expressed and 760 over- expressed genes. Hierarchical clustering showed a clear separation between HD- and MDS-derived samples for both subsets (Figure 3A). Volcano plots were used to show over- and under-expressed genes in HD compared to MDS with fold change levels of <-2.5 or >2.5 and a gene level P-value <0.05 (Figure 3B). Next, DEGs were used for further pathway analysis in order to find biolog- ically relevant differences between HD and MDS sub- sets. Transcripts that were under-expressed in MDS were imported in the STRING v10.5 database and a gene ontology (GO) term enrichment analysis was performed. Six of the most enriched pathways are shown for both subsets (Figure 3C). Pathways highly involved in pro- inflammatory processes and innate immune activation were under-represented in MDS as compared to HD. When uploading lists containing over-expressed genes in MDS, hardly any immune response-related pathways were enriched (not shown). Interestingly, for cDC2 path- ways related to apoptosis were enriched in biological processes as well as in KEGG pathways. For slan+ mono- cytes this analysis mainly yielded pathways containing metabolic- and general cell biology-related processes. In order to confirm these analyses gene set enrichment
HD - male/female
MDS - male/female IPSS
Lowrisk
Intermediate-1
Intermediate-2
Highrisk 5 -
Number 217
HD 30- MDS 187 26 Age - mean, y
HD 62 -
MDS 69 66 Sex
26
20/10 - 134/53 17/9
53 10 71 10 21 -
Missing IPSS score IPSS-R
Very low risk Lowrisk Intermediate risk Highrisk
Very high risk
Missing IPSS-R score WHO
MDS-SLD
MDS-MLD
MDS-RS-SLD
MDS-RS-MLD
MDS-EB-1
MDS-EB-2
Missing WHO 2016 classification
% Blasts
37 6
29 5 48 8 32 4 15 - 12 1 51 8
11 5 65 4 8 2 31 7 24 3 24 - 24 5
<5% 116 13
≥5% 515
MDS: myelodysplastic syndromes; EB: excess blasts; HD: healthy donor; IPSS(-R): (Revised) International Prognostic Scoring System; MLD: multilineage dysplasia; RS: ring sideroblasts; SLD: single lineage dysplasia; WHO: World Health Organisation; y: years.
haematologica | 2022; 107(3)
657
