
Page 91 - 2022_02-Haematologica-web
P. 91
iNKT cells promote tolerance by cDC apoptosis
AB
C
D
E
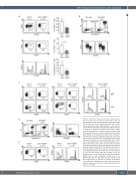
Figure 4. Preferential apoptosis induction of blood conven- tional dendritic cells by invariant natural killer T cells. (A) Representative dot plots and pooled data of activated (CD69, day 1; CD25, day 3) and proliferating (CFSE, day 7) major histocompatibility complex (MHC)-matched T cells after co- culture with blood dendritic cells (DC) from healthy volunteers in presence or absence of invariant natural killer T (iNKT) cells. (B) Representative dot plots showing increased blood DC apoptosis (upper row) and the frequency of plasmacytoid (pDC, CD303+) and conventional DC (cDC, CD1c+) among liv- ing blood DC (annexin V-/propidium iodide [PI]-, lower row) after co-culture with iNKT cells. (C) Representative dot plots showing early and late T-cell activation (CD69, day 1; CD25, day 3) and proliferating T cells (carboxyfluorescein succin- imidyl ester [CFSE], day 7) after co-culture with sorted pDC and cDC from healthy volunteers. (D) Representative dot plots showing apoptosis of blood DC from patients with graft-ver- sus-host disease (GvHD) after co-culture (4 hours) with cul- ture-expanded third-party donor iNKT cells and the frequency of cDC and pDC among living DC (annexin V-/PI-). (E) Representative dot plots showing early and late activation (CD25, day 3) and proliferation (CFSE, day 7) of MHC-matched donor T cells after co-culture with blood DC from GvHD patients in presence or absence of third-party donor iNKT cells. Histograms show the mean of three inde- pendent experiments. Error bars indicate standard error of the mean. *P<0.05.
haematologica | 2022; 107(2)
433
