
Page 82 - 2022_02-Haematologica-web
P. 82
O. di Martino et al.
S7B-F). The list of upregulated genes included CD14 and CD64 (Fcgr1), which at the protein level were observed to increase by immunofluorescence (Figure 1H, Online Supplementary Figure S1C-D). The most highly differentiat- ed transcript out of the cell surface markers was the com- plement factor C3 (Online Supplementary Figure S7D), and additional complement-receptors (C5ar1 and CD59a) also underwent upregulation with RXRA activation (Online Supplementary Figure S7B, F), which correlate with mono- cytic differentiation. We also noted a variety of upregulated integrins (Bcam, Ceacam1, Itgam, Itgb2, Itgb2l, and Itgb7), and these may play a role in the aggregation phenotype of the DT448/9PP variant (Online Supplementary Figure S7C-F).
While the majority of transcripts that were up- or down- regulated overlapped between RXRA WT cells treated with
bexarotene and RXRA DT448/9PP-transduced cells (Figure 5B-D), there were 11 genes that were differentially expressed between these two groups (Online Supplementary Figure S8A). In five, RXRA DT448/9PP augmented the bexarotene-induced response: (upregulated Vsig8, Fcgr1 (Cd64), Camp, Gp6; downregulated: Pik3ip1) (Online Supplementary Figure S8B). The other six displayed three dif- ferent patterns: not expressed in treated or untreated RXRA WT cells and increased in DT448/9PP-transduced cells (Gpr84, S100a8); downregulated from untreated to treated RXRA WT cells and expressed in DT448/9PP-transduced cells (Mpo, Gm28438, Gm10359); or not expressed in untreated RXRA WT with an increase upon bexarotene treatment but not with DT448/9PP (Cited1) (Online Supplementary Figure S8C). This list is too small for pathway
AB
C
D
EF
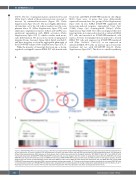
Figure 5. RXRA DT448/9PP transcriptome changes. (A) Schema of experimental design: KMT2A-MLLT3 WT leukemia cells were transduced with the indicated virus- es and cultured for 24 h with or without 250 nM bexarotene; mCherry+ cells were sorted, and total RNA was isolated for RNA sequencing analysis. (B) Heatmap of differentially expressed genes (DEG) between all three groups. Each condition was evaluated by biological triplicates. WT: RXRA WT cells; WT + bex: RXRA WT cells treated with bexarotene; DT448/9PP: RXRA DT448/9PP-transduced cells. (C) Venn diagram with the number of upregulated unique DEG from RXRA WT cells versus RXRA WT cells treated with bexarotene (red) and RXRA WT cells versus RXRA DT448/9PP-transduced cells (blue) and DEG common to both groups (purple). (D) Venn diagram with the number of downregulated unique DEG from RXRA WT cells versus. RXRA WT cells treated with bexarotene (red) and RXRA WT cells versus RXRA DT448/9PP-transduced cells (blue) and DEG in common between both groups (purple). (E, F) Gene set enrichment analysis comparing the untreated RXRA WT cells to the bexarotene-treated and DT448/9PP-transduced cells upregulated (E) and downregulated (F) during myelopoiesis (published gene sets from Brown, et al.26). Heatmaps are shown as row z-scores with the color key below the panel (B). FDR: false discovery rate; NES: normalized enrichment score.
424
haematologica | 2022; 107(2)
