
Page 65 - 2022_02-Haematologica-web
P. 65
A
B
C
APR-246 induced ferroptosis in AM
Figure 2. APR-246 induces ferroptosis in acute myeloid leukemia cells. (A) Cell viability (%) for the indicated cells at 16 hours (h) post-APR-246 treatment (60 mM) with or without ferrostatin-1 (10 mM), deferoxamine (DFO) (100 mM), necrostatin-1 (20 mM), chloroquine (20 mM) or QVD-OPH (25 mM) (n=3). Error bars ± standard error of the mean [SEM]. All compounds were added 2 h (h) prior to APR-246 in the medium. Statistics, 2-way ANOVA; *P<0.05, **P<0.01, ***P<0.0001. (B) Immunoblotting analysis of PARP, caspase 8 and caspase 3 in MOLM-14 cells treated for 16 h with dimethyl sulfoxide (DMSO), APR-246 (60 μM) or puromycin (1 mg/mL). b-actin was used as a loading control (n=2). (C) Viability curves for the indicated cells at 16 h post APR-246 treatment with or without ferrostatin-1 (10 mM), DFO (100 mM), necrostatin-1 (20 mM), chloroquine (20 mM) or QVD-OPH (25 mM) (n=3). Error bars ± SEM. (d) Cell death (%) of the indicated cells at 16 h and 24 h post-APR-246 treatment (50 mM) with or without ferrostatin-1 (10 mM) (n=3). Error bars ± standard deviation.
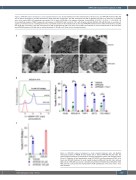
Figure 3. APR-246 induces ferroptosis in acute myeloid leukemia cells. (A) Electron microscopy analysis of MOLM-14 cells treated with or without APR-246 (60 mM, H16). The white arrowhead indicates a mitochondrion showing membrane rupture and reduced cristae. (B and C) Detection of lipid peroxidation using C11-BODIPY and flow cytometry (FCM) at 14 hours post APR-246 treatment in acute myeloid leukemia (AML) cell lines (B) and in primary AML cells (C). APR-246 was used at a 100 mM concentration for MOLM-14 and 50 μM for other AML cell lines. Left panels show representative FCM quantification (n=3). Error bars ± stan- dard deviation.
haematologica | 2022; 107(2)
407
