
Page 20 - 2022_02-Haematologica-web
P. 20
V. Krishnan et al.
Single-cell-based gene expression analysis
Recent advances in single-cell analysis have enabled novel GE-based insights on the roles of tumor cell hetero- geneity and clonal evolution under the selective pressure of therapeutics, with obvious applications in biomarker development.30 Leukemia stem cell (LSC) heterogeneity was characterized by Warfvinge et al. by combining high- throughput immunophenotyping with single-cell GE pro- filing with a defined panel of genes.31 LSC sub-fractions with more primitive and quiescent signatures had a high- er persistence after TKI therapy with the most TKI-insen- sitive population identified as Lin–CD34+CD38low/– CD45RA–cKIT–CD26+ stem cells. Giustacchini et al. used the Smart-seq2 platform to combine single-cell RNA- sequencing analysis with BCR-ABL1 transcript detection using purified stem cells. A sub-population of BCR-ABL1+ quiescent stem cells enriched for hematopoietic stem cell (HSC) signatures was found to persist during TKI therapy.32 Intriguingly, the BCR-ABL1- cells in CML patients were enriched for inflammatory, tumor growth factor-b and tumor necrosis factor-a hallmarks and dis- criminated between the TKI-responder groups.
In addition to LSC-derived signatures, the GE signature of immune cells can be equally instructive. For example, plasmacytoid dendritic cells, the major producers of inter- feron-a in vivo, promoted resistance to nilotinib in CML patients.33 These studies imply that the cytokines released by immune cells in the bone marrow microenvironment, and the transcriptomic changes that they bring about on the LSC, may activate cytokine-dependent TKI resistance programs.34 Together, these single-cell studies demon- strate that GE signatures within malignant and non- malignant compartments in CML are prognostically informative. We anticipate the discovery of additional biomarkers among discrete cell types which have the potential to be assayed by platforms available in standard pathology laboratories, e.g., by flow cytometry or immunohistochemistry.
Gene expression signatures associated with blast crisis progression
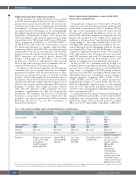
Transcriptomic comparisons between the CP and BC stages have uncovered progression-related signatures that can herald BC transformation (Table 2). In the pre-TKI era, the time to BC transformation from CP varied between patients, and to understand this difference, Yong et al. com- pared CD34+ cells from leukapheresis samples provided by patients who progressed to BC within 3 years (aggressive leukemia) or after more than 7 years (indolent leukemia) fol- lowing diagnosis.13 The study identified that lower CD7 with higher PR3 and ELA2 expression at diagnosis was asso- ciated with longer survival. Intriguingly, when the GE signa- tures identified by Yong et al. and McWeeney et al. were compared, a significant overlap was found.11 This important study demonstrated that biological processes associated with TKI resistance and early BC transformation over- lapped, and that CD34+ cells from different sources (bone marrow vs. peripheral blood) contained this information.
In the post-TKI era, a landmark study by Radich et al. identified distinct transcriptional programs during BC pro- gression.25 About 3,000 genes were associated with the BC stage with a dysregulated WNT/b-catenin pathway, decreased Jun B and FOS, and higher PRAME expression. The Radich dataset was subsequently used to compute a six-gene signature comprising NOB1, DDX47, IGSF2, LTB4R, SCARB1, and SLC25A3 to predict progression.35 Independently, Zheng et al. isolated CD34+ cells and iden- tified 34 differentially expressed genes as cells transited from CP to BC. Among the misregulated genes, SOCS2 and CD52 were downregulated while HLA-related genes were overexpressed in BC.36
To understand the biological mechanisms underlying GE changes in TKI resistance and BC, a recent study tested the hypothesis that prognostically important genes were enriched for targets of the polycomb repressive complex (PRC; see below).10 Importantly, target genes of PRC-asso-
Table 2. Gene expression profiling studies comparing chronic phase and acute phase.
Stage & numbers
Unselected/CD34+; PBMC/BM
Platform N. of genes
Comments
Yong et al., 2006
CP 68
CD34+; PBMC
Microarray 20
Identifies early (≤3 years) vs. late (≥7 years) BC transformation.
Low CD7 & high PR-3 predicts higher OS.
Radich et al., 2006
CP 42; AP17; BC32
Unselected; BM
Microarray 3000+
Identifies TKI-R in CP (had BC-like signature)
Zheng et al., 2006
CP 11; BC9
CD34+; PBMC
Microarray 114
Genes that distinguish CP and BC
Oehler et al., 2009
CP 42; AP17; BC34
Unselected; BM
Microarray 6
Discriminates between early & late CP
Ko et al., 2020
CP 16; MBC13; LBC5
CD34+; PBMC
Microarray
431 Upregulated
LBC 522 downregulated
Identifies a core BC gene expression signature common to MBC and LBC. PRC-driven transcriptional reprogramming is enriched for poor prognostic genes in CP in the CD34+ datasets
of Yong et al. (2006) and McWeeney et al. (2009).
CP: chronic phase; AP: accelerated phase; BC: blast crisis; MBC: myeloid blast crisis; LBC: lymphoid blast crisis; PBMC: peripheral blood mononuclear cells; BM: bone marrow; PR- 3: proteinase-3: OS: overall survival; TKI-R: resistance to tyrosine kinase inhibitors; PRC: polycomb repressive complex.
362
haematologica | 2022; 107(2)
