
Page 19 - 2022_02-Haematologica-web
P. 19
GE-based biomarkers in CML
haematologica | 2022; 107(2)
361
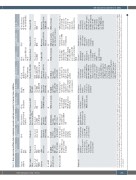
Table 1. Gene expression profiling studies comparing responders and non-responders to tyrosine kinase inhibitors.
Stage& numbers
CP18; AP 2; BC2
CP66
CP29,included patients previously on IFN-a
CP32,
12 validation
CP23R; 11 NR
CP12R;
24 NR (discovery); CP17 R
6 NR (validation)
CP63;
AP 5;
secondary TKI-R 29; BC 27
CP15
CP96(discovery); CP 88 (validation); CP 132 (nilotinib Rx).
Time sample taken
Diagnostic
Diagnostic
Prior to TKI, but could have been on IFN-a
Diagnostic BM
Diagnostic PB&BM
Diagnostic PB & BM
Diagnostic blood
Diagnostic PB
Diagnostic PB
Unselected/ CD34+ cells; PB/BM
Unselected; PB &
MNC
Unselected; whole blood
Unselected; total WBC from PB & BM
Unselected; BM
Unselected; total WBC from BM & PB
CD34+ selected BM MNC & CD34+ PB
MNC in validation group
Unselected; total WBC
Unselected; MNC
Unselected; MNC
Platform
cDNA Microarray
Microarray (Affymetrix HG_U95Av2)
Microarray (Affymetrix HG_U95Av2)
Microarray
(CNIO OncoChip)
Microarray (Affymetrix HG-U133A)
Microarray (Affymetrix HG-U133 Plus 2.0)
TaqMan LDA
Microarray (Affymetrix HG-U133
Microarray (Illumina HT-12v4) TaqMan LDA
N.ofDEG
79
55
-
46
MCyR at 12 months
128 R=MCyR
885
21
CCyR at 12 months
Plus 2.0) 105
365
EMR at 3 months
Time of predicted event
R=MCyR (<35% Ph+); NR= >65%
Ph+ at 5 months
R=CCyR
(0% Ph+); NR= >65% Ph+
R=CCyR within 9 months; NR= >35% Ph+ after 1 year
(≤35% Ph+); NR= ≥35% Ph+ at 12 months
R=CCyR at
12 months; NR= >66% Ph+ at 12 months
CCyR at 12 months;
NR (failed to achieve
any cytogenetic response)
Biological insights
First evidence
that GE profiles can predict sensitivity to imatinib
Predictive genes enriched for cell adhesion, mitogenic signaling, apoptosis
GE comparisons should be made on purified CD34+ cells
Predictive genes associated with Wnt signaling, cell adhesion, NK-kB, apoptosis, DNA repair
Predictive genes enriched for transcriptional regulation of apoptosis, oxidative stress, DNA repair, centrosomal genes
Predictive genes enriched for cell adhesion and targets of the Wnt/b-catenin pathway
Predictive genes involved in TKI influx/efflux, BC progression, BCR-ABL1 signaling; Secondary TKI-R genes similar to BC genes but not primary TKI-R
Comments
79 DEG were identified.
15 or 30 genes were used to develop a prediction score to separate TKI- responders from non-responders
31 genes were used to develop a classifier to separate TKI- responders from non-responders.
No DEG were identified between TKI responders and non-responders
A 6-gene prediction model was constructed which could predict
A 128-gene predictor of primary cytogenetic resistance to imatinib was identified
A 75-probe set classifier that separated the
15 genes distinguished
CP from BC.
12 genes distinguished between secondary TKI-R vs. optimal responders. PTGS1
predicted primary TKI-R
Identified a set of genes whose expression was differentially regulated
A binary classification
model based
on 17 genes. HR-GES: 77% failure, but missed 2/9. LR-GES: 95% did well, but missed 4/79.
Kaneta et al., 2002
McLean et al., 2004
Crossman et al., 2004
Villuendas et al., 2006
Frank et al., 2006
McWeeney et al., 2009
Zhang et al., 2009
de Lavallade et al., 2010
Kok et al., 2019
at 12 months
MCyR at 12 months
responder groups.
PPV 87.7%; NPV 73.7%
PPV 94.4%; NPV 75%.
CD34+ cell selection
& microarray analysis possible, successful
in 71% of patients. Predictive genes overlapped with three independent datasets
for BC genes (Zheng
et al., 2006), genes prediciting early BC transformation (Yong et al., 2006 ), PRC target genes
in BC (Ko et al., 2020).
in patients resistant to imatinib
CP: chronic phase; AP: accelerated phase; BC: blast crisis; R: responder; NR: non-responder; TKI-R: resistance to tyrosine kinase inhibitors; Rx: treatment; TKI: tyrosine kinase inhibitor; IFN-: interferon-alpha; BM: bone marrow; PB: peripheral blood; PBMC: peripheral blood mononuclear cells; MNC: mononuclear cells; WBC: white blood cells; N.; number; DEG: differentially expressed genes; MCyR: major cytogenetic response; CCyR: complete cytogenetic response; Ph+: Philadelphia chromosome-positive; EMR: early molecular response; GE: gene expression; GSEA: gene set enrichment analysis; DEG: differentially expressed genes; PPV: positive predictive value; NPV: negative predictive value; HR-GES: high-risk gene expression signature; LR-GES: low-risk gene expres- sion signature.
Predictive genes enriched for DNA repair by recombination
GSEA indicated genes associated with poorer outcome enriched for cell cycle, stem cell function, &
depleted for immune function.
64% sensitivity; 97% specificity. HR-GES had lower rate of EMR failure with nilotinib
