
Page 192 - 2022_02-Haematologica-web
P. 192
O. Abdulmalik et al.
AB
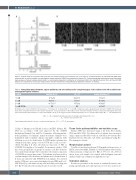
Figure 1. S-NACH binds to intracellular HbS (and HbF) and inhibits sickling of SS red blood cells under hypoxia. In this experiment, SS red blood cells (RBC) were incubated with or without sulfated non-anticoagulant heparin derivative S-NACH and subjected to hypoxia. (A) Cation-exchange high performance liquid chromatog- raphy analyses of aliquot samples demonstrated a concentration-dependent modification of intracellular HbS to the high-affinity adduct form. (B) Fixed SS RBC aliquots were subjected to microscopic image analysis and demonstrated a corresponding dose-dependent inhibition of sickling.
Table 1. Hemoglobin adduct formation, oxygen equilibrium, and anti-sickling studies using homozygous sickle red blood cells with a sulfated non- anticoagulant heparin derivative.
S-NACH
0.5 mM 1.0 mM 2.0 mM
1.0 mM GBT440
Modified Hb (%)a
20.5±8.2 44.5±13.0 69.7.5±5.5 ND
DP50 (%)b 21.2±10.6
57.6±9.0
65.7±3.2
ND
Sickling inhibition (%)c
33.1±5.3 58.6±14.3 85.8±4.7 92.7±4.7
All studies were conducted with SS cell suspensions (20% hematocrit) incubated with 0.5,1,of 2 mM of sulfated non-anticoagulant heparin derivative (S-NACH).The results are mean values ± standard deviation for five separate experiments (biological replicates).aHbS adduct values obtained from high performance liquid chromatography elution pat- terns of hemolysate after incubation of compounds with SS cells. bP50 is the oxygen pressure at which hemolysates are 50% saturated with oxygen. DP50 (%) was determined as:
DP50 (%) = P50 of lysates from untreated cells - P50 of lysates from treated cells x 100 P50 of lysates from untreated cells
cAnti-sickling studies with SS cells were conducted under hypoxia (2.5% O2/97.5% N2 gas mixture).
College of Pharmacy and Health Sciences (ACPHS; Albany, NY, USA) in accordance with and approved by the ACPHS Institutional Animal Care and Use Committee following institu- tional guidelines for humane animal treatment. Animals were maintained under standard climatic and light conditions with ad libitum access to food and water. For TFPI analysis, plasma was obtained from three groups of four C57/B mice each, via retro- orbital bleeding 2 h after subcutaneous injections of PBS or S-NACH (100 mg/kg or 300 mg/kg). For normoxic studies, SCD mice were grouped into six groups of six mice each. Blood smears were made from tail snips before and after subcutaneous injection of S-NACH at various time points. Total plasma was harvested for cytokine analysis. Blood smears and plasma were obtained after 2 h from six untreated and 5-HMF-treated animals. For survival studies, SCD mice were treated with physiological PBS (n=6) or S- NACH (n=8) by subcutaneous injection and subjected to hypoxia (5% O2) 30 min after the treatments and observed for 1.5 h.
Tissue factor pathway inhibitor and cytokine assays
Plasma TFPI was measured using a kit from Neoscientific (Woburn, MA, USA). Cytokines in blood plasma were measured using commercial Bio-Plex beads in a Bio-Plex 200 system (Bio- Rad Laboratories, Hercules, CA, USA), and analyzed using Bio- Plex manager software.
Morphological analysis
Total blood was harvested from SCD animals in the presence of EDTA, treated with PBS, 5-HMF, or S-NACH and incubated under either normoxia or hypoxia (2% O2) at 37°C for 1 h. A blood smear from each sample was stained with Leishman stain and analyzed under an oil immersion light microscope.39
Statistical analyses
Results are presented as the means ± standard deviation com- paring experimental and control groups. A t-test was used for sta-
534
haematologica | 2022; 107(2)
