
Page 88 - 2022_01-Haematologica-web
P. 88
A. Damnernsawad et al.
other screen hits, including RASA2, TBC1D7, NPRL2, and DEPDC5.
In MOLM13 cells, engineered to model LZTR1 and NF1 deficiencies, we observed elevated levels of phosphorylated ERK, suggesting increased activation of the MAPK signaling
pathway (Figure 2B). As MAPK can cross-activate MTOR signaling,39-41 we observed increased phosphorylation level of MTORC1, similar to results with inactivated inhibitory functions of TSC1 and TSC2, indicating common aberran- cy in downstream signaling (Figure 2B). Elevated levels of
AB
C
DE
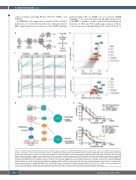
Figure 1. A genome-wide CRISPR knockout screen identifies negative regulators of MAPK and MTOR pathways, LZTR1, NF1, TSC1/2 and NPRL2, attenuating sen- sitivity to sorafenib in acute myeloid leukemia cell lines. (A) Schematic representation of the CRISPR knockout screen in MOLM13 acute myeloid leukemia cells. (B) Scatter plots of differential enrichment of single guide (sg)RNA in sorafenib-treated versus dimethylsulfoxide (DMSO)-treated control cells, analyzed at day 14 of drug exposure. Median log fold changes are plotted versus P-values (top panel), and false discovery rate (FDR)-adjusted P-values (bottom panel), generated from MAGeCK robust ranked aggregation (RRA) analysis. Colors represent various tiers associated with the ranking system based on directional concordance among sgRNA and significance of fold increase (see Methods section). (C) Plots of normalized sgRNA read counts targeting the five top candidate genes from sorafenib- and DMSO- treated samples over time. (D) Diagram of the MAPK and MTOR pathways with top hit genes shown in red circles. (E) Dose response curve of the 72 h sorafenib sen- sitivity assay performed on parental MOLM13 cells and MOLM13 cells transduced with sgRNA targeting LZTR1, NF1, TSC1, TSC2, NPRL2, and non-targeting (NT) control. The percentages of viable cells were measured using the MTS assay in triplicate with seven-point escalating drug concentrations.
80
haematologica | 2022; 107(1)
