
Page 353 - 2022_01-Haematologica-web
P. 353
Letters to the Editor
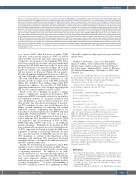
Figure 2. Inactivating mutations in WT1 provide a growth advantage for PML-RARA-transduced CD34+ cells. (A) Umbilical cord blood-derived CD34+ cells were transduced with GFP-tagged lentiviruses encoding the two most common WT1 isoforms (KTS+ and KTS-), or an empty vector. Cells were maintained in culture with cytokines, and GFP+ cells were quantified at different time points. Shown are percent GFP+ cells over time in WT1 (right) or empty vector (left) transduced cultures normalized for transduction efficiency at beginning of the culture period (n=4 individual experiments). Black dotted lines show line of best fit calculated by linear regression. Transduction with WT1 isoforms (KTS+ and KTS-) leads to loss of GFP+ cells (slope b=-1.18 per day, P<0.001), while empty vector-transduced cells have GFP+ cells throughout the culture period (slope b=-0.54, P=0.32). P-values were calculated using a linear regression model, and represent the probability that the slope of the best fit line equals zero. (B) Human CD34+ cord blood cells were transduced with PML-RARA-expressing retro- virus or empty vector, and 48 hours later CRISPR/Cas9 was used to generate mutations in WT1 (exon 1 or exon 8) or AAVS1 (a negative control locus). GFP+ cells were sorted at different time points from cultures that had been transduced with a vector containing PML-RARA (right panels) or no insert (empty vector, left panels). DNA was isolated and polymerase chain reaction products containing the guide RNA target sites were digitally sequenced to determine the precise variant allele frequencies of mutations in WT1 (bottom panels) or AAVS1 (top panels). Shown are change in variant allele frequency (VAF) of AAVS1 mutations or WT1 mutations over time (n=3-6 separate experiments). Mutations in WT1 exon1 are shown in green, or WT1 exon 8 in red. Black dotted lines show line of best fit calculated by linear regression. Cells containing mutations in WT1 show a trend toward expansion in empty vector-transduced CD34+ cells (slope b=0.003 increase per day, P=0.20), and a statistically significant expansion in PML-RARA-transduced cells (slope b=0.006 increase per day, P=0.007). In con- trast, cells with mutations in AAVS1 do not expand over time. P-values were calculated using a linear regression model, and represent the probability that the slope of the best fit line equals zero. (C) Increase in overall cell numbers in cultures transduced with GFP (left) or PML-RARA (right). P-values were calculated using Student’s t-test.
as a control, AAVS1. After 4-8 weeks in culture, GFP+ cells were sorted and the frequency of WT1 or AAVS1 indels in GFP+ cells at the end of the culture period was compared to the frequency at the beginning. WT1 muta- tions were selected for over time, and were significantly increased in PML-RARA-transduced cells 4-8 weeks after the WT1 mutations were introduced (Figure 2B, bottom panels). In contrast, cells containing mutations in AAVS1 did not increase in frequency (Figure 2B, top panels). Overall cell numbers significantly increased in cells bear- ing both PML-RARA and WT1 mutations, compared to cells with PML-RARA and AAVS1 mutations, or cells transduced with an empty vector with WT1 mutations (Figure 2C). Together, these findings suggest that WT1 inactivation enhances the growth of PML-RARA- expressing hematopoietic cells, strongly suggesting that WT1 acts as a tumor suppressor in this context.
Based on the above findings, we propose a simple model to explain these paradoxical observations: WT1 expression in HSPC is normally activated as an adaptive and inhibitory response to oncogenic mutations that cause proliferation, a response that is intended to slow their growth. The subsequent development of inactivat- ing WT1 mutations in some cases would then provide a further growth advantage by removing that normal inhibitory response. Supporting this hypothesis, we found that i) retroviral transduction of CD34+ cells with PML-RARA, RUNX1-RUNX1T1, or MYC all led to a robust induction of WT1 expression; ii) forced expres- sion of wild-type WT1 by itself does not promote CD34 cell expansion; and iii) inactivation of WT1 in PML- RARA-expressing CD34+ cells leads to an additional growth advantage. Although the mechanism of WT1 gene activation by oncogenes is not yet clear, high levels of WT1 expression are found in nearly all AML cases, regardless of subtype or mutational landscape. In addi- tion, since the majority of AML/APL cases do not have WT1 mutations, a corollary of this hypothesis is that leukemias with wild-type WT1 must have developed alternative means to circumvent the inhibitory pressure that WT1 induction may exert.
Finally, the downstream mechanisms by which WT1 mutations lead to a growth advantage in AML cells are currently unclear, and may depend on the context of the co-operating mutations. In addition to its well- described function as a locus-specific transcription fac- tor,12 recent studies have suggested that WT1 mutations may cause epigenetic changes via effects on DNA methylation and interactions with TET family methyl- cytosine deoxygenases.13-16 A better understanding of how WT1 mutations activate these pathways in AML
cells will be required to fully exploit their potential ther- apeutic value.
Matthew J. Christopher,1 Casey D. S. Katerndahl,1 Hayley R. LeBlanc,1 Tyler T. Elmendorf,1 Vaishali Basu,1 Margery Gang,1 Andrew J. Menssen,1 David H. Spencer,1 Eric J. Duncavage,2 Shamika Ketkar,1° Lukas D. Wartman,1 Sai Mukund Ramakrishnan,1 Christopher A. Miller1 and Timothy J. Ley1
1Section of Stem Cell Biology, Division of Oncology, Department of Internal Medicine, Washington University in St. Louis, St. Louis, MO and 2Department of Pathology and Immunology, Washington University in St. Louis, St. Louis, MO, USA
°Current address: Department of Molecular and Human Genetics, Baylor College of Medicine, Houston, TX, USA
Correspondence:
MATTHEW J. CHRISTOPHER- christopherm@wustl.edu doi:10.3324/haematol.2021.279601
Received: July 9, 2021.
Accepted: October 12, 2021.
Pre-published: October 21, 2021.
Disclosures: no conflicts of interest to disclose.
Contributions: MJC performed data analysis, supervised the study, and wrote the manuscript; DHS performed data analysis; EJD, SK, LDW, SRM and CAM performed data analysis; CDSK, HRL, TTE, VB, MG and AJM performed experiments; TJL supervised the study and wrote the manuscript.
Acknowledgments: technical assistance was provided by the Siteman Cancer Center Tissue Procurement and Cell Sorting cores (NCI Cancer Center Support Grant P30CA91842). Umbilical cord blood units were provided by the St. Louis Cord Blood Bank.
Funding: this work was supported by the National Cancer Institute to MJC (K12 program, CA167540, R. Govindan, PI; SPORE Career Enhancement Award, P50 CA171963, D. Link, PI; and K08CA222630). Additional support was provided by NIH grants CA101937 and CA197561 (TJL), CA211782 (CAM), T32 HL007088 (CDSK), K08CA190815 (DS), and the Barnes Jewish Hospital Foundation (TJL).
References
1. Royer-Pokora B, Beier M Fau - Henzler M, et al. Twenty-four new cases of WT1 germline mutations and review of the literature: geno- type/phenotype correlations for Wilms tumor development. Am J Med Genet A. 2014;127A(3):249-257.
2. Ley TJ, Miller C, Ding L, et al. Genomic and epigenomic landscapes of adult de novo acute myeloid leukemia. N Engl J Med. 2013;368(22):2059-2074.
3. Cilloni D, Gottardi E, De Micheli D, et al. Quantitative assessment
haematologica | 2022; 107(1)
345
