
Page 351 - 2022_01-Haematologica-web
P. 351
Letters to the Editor
CD
E
B
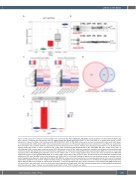
Figure 1. WT1 expression is induced in human CD34+ cells transduced with RUNX1-RUNX1T1, PML-RARA, or MYC. Umbilical cord blood-derived CD34+ cells were cultured in cytokines after transduction with GFP-tagged retroviruses expressing RUNX1-RUNX1T1, MYC, PML-RARA, or an empty vector control. (A) WT1 expression is induced in CD34+ cells transduced with RUNX1-RUNX1T1, MYC, or PML-RARA compared to controls transduced with empty vector (GFP, green) or untransduced cells (CD34, pink). CD34+ cells transduced with each vector (n=2-6 separate experiments) were cultured for 7 days, RNA was isolated from flow-sorted GFP+ cells, and WT1 mRNA was quantified by real time polymerase chain reaction. P-values were calculated using Student’s t-test. (B) Western blot showing expression of WT1 in CD34+ cord blood cells 7 days after transduction with RUNX1-RUNX1T1 (AE), PML-RARA (PR), MYC, empty vector (GFP), or untransduced (CTRL). Lysates were made from sorted GFP+ cells except control (CTRL), which was made from equivalent cell numbers of untransduced cells cultured in parallel. Blot represents one of 3 representative experiments. (C) Heatmaps showing differentially expressed genes (DEG) in human or mouse cells transduced with a PML-RARA-expressing MSCV vector. Human CD34+ cells or mouse lineage-depleted bone marrow cells were transduced with IRES-GFP- tagged retroviruses containing a PML-RARA cDNA, or no insert (empty vector). After 7 days in culture, GFP+ cells were flow sorted and RNA was isolated for RNA sequencing. DEG were identified using a false discovery rate (FDR) cutoff of <0.05 after filtering out genes with low expression across all samples (see the Online Supplementary Appendix). Heatmaps show DEG in PML-RARA vs. empty vector-transduced human (n=2 separate experiments) and mouse (n=3 separate experiments) progenitor cells. (D) Venn diagram showing overlap in orthologous mouse and human DEG from (C). Of 4,915 mouse DEG having human ortho- logues, 867 are DEG in the analysis of human genes (P=9.6x10-118 using the hypergeometric test). (E) WT1 expression is increased by PML-RARA transduction in human CD34+ cells (left panel), but not in mouse bone marrow-derived cells (right panel). WT1/Wt1 expression values from the RNA sequencing experiment described above are shown. P-values were calculated using Student’s t-test. TPM: transcripts per million.
haematologica | 2022; 107(1)
343
A
