
Page 347 - 2022_01-Haematologica-web
P. 347
Letters to the Editor
ABC
DEF
GHI
JKL
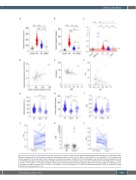
Figure 1. Index of ineffective erythropoeisis and other biological parameters in SCD. A graph representing the (A) absolute reticulocyte count (ARC) (B) Soluble Transferrin Receptor (sTfr) and (C) Index of Ineffective Erythropoiesis (IoIE) in control (n= 22), HbSS (n= 182), HbSC (n= 87) and HbS/b+ (n= 12) patients; the red box represents the normal range of IoIE. A Spearman correlation plot between (D) ARC and sTfr, (E) Hemoglobin and IoIE and (F) Fetal hemoglobin and IoIE in the HbSS group (n=182). A graph showing the (G) ARC, (H) sTfR and (I) IoIE in non-treated (n=182), transfusion (n=58) and HU (n=50) HbSS groups. *P<0.05, **P<0.01, ***P<0.001 ****P<0.0001. (J) Effect of HU therapy on patient IoIE measurements. Each line represents the change in IoIE of an individual patient from before to during HU therapy (n=20). (K) IoIE in non-treated (n= 23) and transfused (n= 22) HbE/b-thalassemia patients (L) Effect of transfusion therapy on patient IoIE measurements (n=17).
haematologica | 2022; 107(1)
339
