
Page 295 - 2022_01-Haematologica-web
P. 295
Letters to the Editor
In classical Hodgkin lymphoma the combination of the CCR5 antagonist maraviroc with trabectedin synergizes, enhances DNA damage and decreases three-dimensional tumor-stroma heterospheroid viability
Several preclinical and clinical studies have demon- strated a key role of the CCL5/CCR5 axis in cancer, pro- viding the rationale for clinical trials with the CCR5 antagonist maraviroc.1 Indeed, maraviroc, approved by the Food and Drug Administration as an antiretroviral for the treatment of human immunodeficiency virus infec- tions, has been repurposed as a potential therapeutic option for cancer treatment since it was demonstrated to inhibit tumor growth, metastasis formation, and the cre- ation of a tumor-promoting microenvironment (TME).2,3
In breast cancer, CCR5+ tumor cells are characterized by increased levels of DNA repair genes and maraviroc enhanced both the cell killing and the DNA damage mediated by the DNA-damaging agent doxorubicin.4
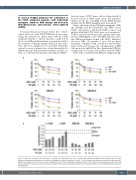
Tumor cells from classical Hodgkin lymphoma (cHL) (the Hodgkin and Reed-Sternberg cells, HRS) secrete CCL5,5 and express a functional CCR5 receptor,6 and patients with high CCL5 levels have a poor prognosis.5 CCR5 is activated in both autocrine6 and paracrine5 man- ners by CCR5-ligands secreted by HRS cells, monocytes and cHL-mesenchymal stromal cells (MSC). Maraviroc decreases HRS cell growth in vitro and in tumor xenografts, synergizes with doxorubicin and brentux- imab vedotin and decreases the self aggregation of HRS cells, monocytes and MSC in three-dimensional (3D) het- erospheroids, used as an in vitro model to study the TME.5
Trabectedin covalently binds DNA, blocking transcrip-
A
B
Figure 1. Maraviroc synergized with trabectedin in Hodgkin and Reed-Sternberg cells. L-1236, L-428, KM-H2 and HDLM-2 cells (2.0x10⁵ cells/mL), were exposed to increasing concentrations of maraviroc, trabectedin and their combination. (A) After 72 h cell viability was evaluated by trypan blue dye exclusion. Results (percentage of control) are mean and standard deviation of three independent experiments each run in triplicate. (B) Synergy was determined using Calcusyn software. Values of bar charts are mean combination index values and standard deviation of three experiments each run in triplicate. MVC: maraviroc; TB: trabectedin.
haematologica | 2022; 107(1)
287
