
Page 169 - 2022_01-Haematologica-web
P. 169
Nupr1 regulates the quiescence threshold of HSC
ative regulation of cell cycle (Online Supplementary Figure S5A, B). In addition, the positive regulatory genes of cell cycle, such as Cdk4, Cdk6, Akt1 and Akt2, were upregulated in the Nupr1-/- HSC. However, regulators of HSC quies- cence, such as Gfi1, Pten, Hlf, Cdc42 and Foxo1 were down- regulated in the Nupr1-/- HSC (Online Supplementary Figure S5C).43,44 Gene set enrichment analysis illustrated that genes related to p53 pathways feedback loops, including Trp53, Ccng1, Ctnnb1, Pten, and Pik3c2b, were enriched in WT HSC (Figure 5A). The p53 pathway regulates a series of target genes involving cell cycle arrest, apoptosis, senescence, DNA repair, and metabolism.45 Interestingly, the expression of p53 was significantly reduced (P<0.001) to one-third of the control value in Nupr1-/- HSC (Figure 5B). Therefore, we hypothesized that downregulation of p53 in Nupr1-/- HSC might account for the competitive advantage of the HSC. MDM2 is a ubiquitin ligase E3 for p53, which is a key repressive regulator of p53 signaling.46 Mdm2-deficient mice showed increased levels of active p53, which is an ideal substitute model of upregulating p53 since directly overex- pressing p53 leads to cell death and blood malignancies in mice.27,47 Nupr1-/- mice were crossed with Mdm2+/- mice to achieve upregulation of p53 expression in Nupr1-/- HSC. As expected, the levels of p53 protein expression in Nupr1-/-
Mdm2+/- HSC were comparable to those in WT HSC (P>0.05) but significantly higher than those in Nupr1-/- HSC, as measured by indirect immunofluorescence (Figure 5C, D). In addition, most genes involved in the p53 pathway were upregulated in the Nupr1-/-Mdm2+/- HSC, indicated par- tial recovery of the p53 pathway (Online Supplementary Figure S6). We next examined phenotypic HSC in the Nupr1-/-Mdm2+/- mice. Flow cytometry analysis showed that the Nupr1-/-Mdm2+/- HSC pool was indistinguishable from the WT, Nupr1-/-, and Mdm2+/- counterparts in terms of ratios and absolute numbers (Figure 6A, B). Furthermore, we test- ed the competitiveness of Nupr1-/-Mdm2+/- HSC in parallel with WT, Nupr1-/-, and Mdm2+/- HSC. BMNC (2.5x10⁵) from WT, Nupr1-/- Mdm2+/- mice (CD45.2), Nupr1-/- mice (CD45.2), or Mdm2+/- mice (CD45.2) were transplanted into lethally irradiated recipients (CD45.1) along with the same number of WT (CD45.1) BMNC. In the recipients of Nupr1-/-Mdm2+/- donor cells, the contribution of Nupr1-/-Mdm2+/- cells was significantly reduced (P<0.001) to ~20%, which was far below the percentage of Nupr1-/- cells in recipients of Nupr1-/- donor cells, and Mdm2+/- cells accounted for less than 10% in the peripheral blood of recipients 16 weeks after transplantation (Figure 6C). Sixteen weeks after trans- plantation, we also analyzed the Nupr1-/-Mdm2+/- HSC in the
B
A
C
D
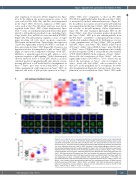
Figure 5. Loss of Nupr1 confers repopulating advantage on hematopoietic stem cells by regulating p53 check-point signaling. (A) Gene set enrichment analysis (GSEA) of p53 pathway feedback loops in wild- type (WT) hematopoietic stem cells (HSC) and Nupr1-/- HSC. One thousand HSC from the bone marrow of WT and Nupr1-/- mice were sorted as individual samples for RNA-sequencing. DESeq2 normalized val- ues of the expression data were used for GSEA. Expression of the leading-edge gene subsets is shown. p53 pathway feedback loops that are downregulated in Nupr1-/- HSC (>1.2-fold difference in expression; adjusted P value <0.05). WT HSC, n=4 cell sample replicates (one per column); Nupr1-/- HSC, n=4 cell sample replicates (one per column). FDR: false discovery rate. (B) Expression level of p53 in WT HSC and Nupr1-/- HSC determined by RNA-sequencing. The Y-axis indicates the expression value (DESeq2 normal- ized values of the expression data. Data were analyzed using an unpaired Student t-test (two-tailed) and are represented as mean ± standard deviation (SD) (n=4 mice for each group). ***P<0.001. (C) Immunofluorescence measurement of p53 proteins in single HSC from WT, Nupr1-/-, Mdm2+/-Nupr1-/- and Mdm2+/- mice. Images of three representative single cells from each group are shown. (D) Mean intensity of p53 fluorescence in WT, Nupr1-/-, Mdm2+/-Nupr1-/- and Mdm2+/- HSC. Each dot represents a single cell. Data were analyzed by one-way analysis of variance and are represented as mean ± SD. WT, n=18; Nupr1-/-, Mdm2+/-Nupr1-/-, Mdm2+/-: n=25. ***P<0.001.
haematologica | 2022; 107(1)
161
