
Page 40 - 2021_12-Haematologica-web
P. 40
L. Zalmai et al.
and short pseudopodia (Figure 1A to C). Lymph node involvement was reported in one patient, and skin lesions in four other patients (26.7%). Pathology analysis of skin lesions found myeloblast infiltration without pDC in patients N2 and N8, and pDC proliferation in patients N9 and N11. No clonal aberration was detected on karyotype for nine cases, while three others had trisomy 13 (N1, N9 and N11), two had chromosome 7 defects (N14, N16), and one had Y loss (N20). Two patients with normal kary- otype were rearranged for KMT2A (N8, N35), and a dele- tion of EZH2 was detected by fluorescence in situ hybridization (FISH) in patient N16.
Immunophenotype identified different subpopulations in patients
In contrast to BPDCN, cells of interest were heteroge- neous, with a significant population of CD45low CD34+ immature myeloid blasts (44%; range, 10-80%) without markers of pDC commitment on the one hand, and an excess of CD4+ CD123+ HLA-DR+ cTCL1+ CD303+ pDC
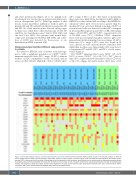
(15%; range, 4-36%) on the other hand. Consequently, these cases more likely fit the description of pDC-AML (or MPDCP associated with AML according to the WHO clas- sification)8 where pDC were in excess, greater than 4% (median 15%) in our cohort. Indeed, a median of 0.25% of total nucleated cells was detected for the pDC contingent in 15 normal BM aspiration and 0.24% in PB, with similar ranges of 0.02-0.95% and 0.17-0.53%, respectively. For 11 of 15 AML cases (73%), CD45low CD34+ immature blasts were more frequent than pDC, whereas pDC were preponderant in the remaining four cases (range, 10-26%). Monocytes (3%; range 1-10%) were also found in 14 cases, greater in acute myelomonocytic leukemia (M4- AML) than in other cases. Interestingly, cDC were detect- ed in patients N7 and N8 (4.8% and 19% of cells respec- tively) (Figure 2).
The CD45low immature blasts were CD34+ (15 of 15, 100% of cases), CD117+ (11 of 15; 73%), TdT+ (five of nine; 56%), expressed myeloid markers such as CD13 (11 of 15, 73%) (Figure 1D and E) and/or CD33 (five of 15,
Figure 2. Immunophenotypic features of plasmacytoid dendritic cell-acute myeloid leukemia. Positive high on 100% of cells in red (>10x4), positive on 100% of cells in orange (10x2 to 10x4), partially positive in light yellow, negative (<20%) in green, not done in grey. CD15 and CD65 are both labeled by fluorescein isothio- cyanate (FITC) in the same tube of our panel. ¤Percentage of cells corresponds to flow cytometry, quantification on the sample used for phenotyping, possibly diluted by peripheral blood. All cases exhibited more than 20% of blasts on bone marrow smears. $Analyses performed on sample obtained after induction of chemotherapy, 70 days after diagnosis. cCD3, CD3, CD19, cCD79a were negative for all cases and all fractions. pDC: plasmacytoid dendritic cells; cDC: conventional DC; Mono: monocytes; AML: acute myeloid leukemia; M0-AML: AML with minimal differentiation.
3060
haematologica | 2021; 106(12)
