
Page 162 - 2021_12-Haematologica-web
P. 162
M.N. Zeissig et al.
splenomegaly in the OPM2-EV-1 model was significantly reduced compared with vehicle controls in CCX9588-treat- ed mice (P<0.001; Figure 7G). Splenomegaly was not observed in the RPMI-8226-luc model, precluding assess- ment of the effect of CCX9588 on splenic dissemination (Figure 7G). When treatment was delayed until 2 weeks post OPM2-EV-1 tumor cell inoculation, CCX9588-treated mice showed significantly reduced numbers of circulating tumor cells (P<0.01; Online Supplementary Figure S5B) although delayed treatment did not significantly decrease tumor burden in the contralateral leg (P=0.08; Online Supplementary Figure S5C).
Discussion
MM is characterized by the presence of multiple tumors throughout the skeleton, and in some patients, soft tissues. The dissemination of MM PC is central to the progression of disease and subsequent disease relapse, highlighting the therapeutic potential of targeting key factors that regulate dissemination to delay disease progression and prevent overt relapse. While the inhibition of several factors, includ- ing selectins,30 N-cadherin31,32 and CXCR433 have been demonstrated to slow BM homing of MM cells in vivo, very few genes have been demonstrated to play a role in the spontaneous dissemination of MM PC from the BM. For example, overexpression of heparanase, an enzyme that cleaves heparan sulphate chains, has been reported to increase the incidence of spontaneous dissemination of
MM cells in a mouse MM xenograft model.34 Additionally, recent data suggests that the transcription factor Twist-1 increases dissemination in an intratibial 5TGM1/KaLwRij model in vivo.35 Furthermore, as far as we are aware, no ther- apeutic interventions have been described that can inhibit spontaneous dissemination of MM PC in vivo. Here, our findings suggest a novel role for the chemokine receptor CCR1 in regulating the egress of MM PC from the BM to the circulation during dissemination. These findings are consistent with a role for CCR1 in metastasis in other can- cer settings, with a study showing that short hairpin RNA- knockdown of CCR1 decreased migration of hepatocellular carcinoma cells in vitro and reduced the incidence of lung metastasis in vivo.36
We have previously demonstrated that hypoxia, through induction of HIF-2α, increases the expression of CCR1 in human MM cell lines.17 This led us to hypothesize that tumor growth in the BM exacerbates BM hypoxia, leading to increased CCR1 expression and tumor dissemination.17 Consistent with this hypothesis, our flow cytometric analy- sis suggests that CCR1 expression on BM PC is increased in MM patients compared with MGUS patients. In addition, our analysis suggested that elevated CCR1 expression is an independent predictor of poor overall survival in MM patients. Mechanistically, we have previously demonstrat- ed that CCL3 treatment of human MM cell lines reduces their capacity to migrate towards exogenous CXCL12 or undergo cytoskeletal remodeling in response to CXCL12 treatment.17 Furthermore, we found that the human MM cell line U266, which does not respond to exogenous
ABC
DE
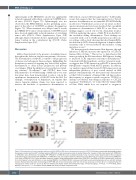
Figure 5. Dissemination of human multiple myeloma cell line OPM2 in NSG mice is abrogated by knockout of CCR1. (A) Primary tumor burden (percentage of green fluorescence protein positive [GFP+] multiple myeloma [MM] cells of total mononuclear cells) in injected tibiae after 4 weeks in NSG mice injected with OPM2-EV-1 or OPM2-KO-1 cells. (B) Number of circulating GFP+ OPM2-EV-1 or OPM2-KO-1 cells in peripheral blood of mice. (C) Tumor burden disseminated to the non-injected contralateral leg in mice injected with OPM2-EV-1 or OPM2-KO-1 cells. (D) Length of spleens collected from naïve NSG mice (n=7 mice) or mice bearing OPM2-EV-1 (n=3 mice) or OPM2-KO-1 (n=3 mice) cells were measured. Image of three representative spleens from OPM2-EV-1- and OPM2-CCR1-KO-1-bearing mice. Scale bar: 10 mm (E) Splenic tumor cell infiltration in mice bearing OPM2-EV-1 or OPM2-CCR1-KO-1 cells was confirmed by immunohistochemistry with an anti-GFP antibody (brown). Representative flow plots of percentage of GFP+ MM cells of total mononuclear cells from one mouse per group are shown (B to C). A representative of 5 mice/group is shown; scale bar: 10 mm (E). Box and whisker plots depict median and interquartile range, n=9-10 mice/group. **P<0.01, ****P<0.0001, Mann- Whitney U test (A to C), ****P<0.0001, one-way ANOVA with Tukey’s multiple comparisons test.
3182
haematologica | 2021; 106(12)
