
Page 145 - 2021_12-Haematologica-web
P. 145
Megakaryocytic activation and fibrotic evolution of MPN
ABC
DEF
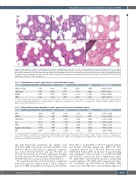
Figure 1. Representative images of megakaryocytic activation in polycythemia vera (A to C) and in early/prefibrotic primary myelofibrosis (D to F). (A and D) Emperipolesis, defined as the presence of at least one leukocyte (indicated by black arrows) or a precursor of hematopoiesis within the cytoplasm of a megakaryocyte (MK) (400X magnification); (B and E) MK clustering, defined as an aggregation of three or more MK in close contact with each other (200X and 400X magnification for panels B and E, respectively); (C and F) peri-MK fibrosis, defined as the arrangement of collagen fibers around the perimeter of activated MK (400X and 200X magnification for panel C and F, respectively).
Table 3. Polycythemia vera cohort: progression-free survival multivariate analysis.
Covariate
Major bleeding JAK2 status M-ACT
WBC
b SE -0.1562 0.3890
1.0726 0.4191
2.3435 0.4761
-0.1520 0.3604
Wald
0.1614 6.5500 24.2335
0.1780
P
0.6879
0.0105
<0.0001
0.6731
Exp(b)
0.8554 2.9229 10.4180 0.8590
95% CI of Exp(b)
0.3991 to 1.8333 1.2855 to 6.6460 4.0978 to 26.4858 0.4239 to 1.7407
b: coefficient estimates; SE: standard error for coefficient estimates b; Exp(b): hazard ratio value; 95% CI of Exp(b)= 95% Confidence Interval of hazard ratio. Major bleeding vs. no major bleeding; JAK2 burden≥50% vs. JAK2 burden<50% (JAK2 status); megakaryocyte activation vs. no megakaryocyte activation (M-ACT); WBC≥11.0x10⁹/L vs. WBC<11.0x10⁹/L; WBC: whitel blood cell count.
Table 4. Early/prefibrotic primary myelofibrosis subset: progression-free survival multivariate analysis. Covariate b SE Wald P Exp(b)
95% CI of Exp(b)
1.0673 to 2.2294 1.5598 to 2.9661 1.0395 to 2.0124 1.1153 to 2.0240 0.8524 to 1.6919 0.9668 to 1.9167 0.9235 to 1.7551
WBC
M-ACT
CALR status
Sex
LDH
Palpable splenomegaly
PLT
0.4334 0.1879 5.3207 0.7659 0.1640 21.8235
0.0211 1.5425 <0.0001 2.1510 0.0285 1.4463 0.0074 1.5024 0.2952 1.2009 0.0773 1.3613 0.1405 1.2731
0.3690 0.1685 0.4071 0.1520 0.1831 0.1749 0.3084 0.1746 0.2415 0.1638
4.7956 7.1702 1.0958 3.1217 2.1729
b: coefficient estimates; SE: standard error for coefficient estimates b; Exp(b): hazard ratio value; 95% CI of Exp(b): 95% Confidence Interval of hazard ratio; WBC: white blood cell count;PLT:platelet count;LDH:lactose dehydrogenase;M-ACT:megakaryocyte activation.CALR mutations vs.no CARL wt (CARL); sex male vs. female (sex);megakaryocyte activation vs. no megakaryocyte activation (M-ACT); WBC count ≥11.0x10⁹/L vs.: WBC<11.0x10⁹/L; LDH≥250 UI/L vs. LDH<250 UI/L; palpable splenomegaly vs.no palpable splenomegaly; PLT≥450x109/L vs. PLT<450x109/L.
and with hematologic parameters, like platelet count (P=0.0001), LDH serum levels (P=0.002) and WBC count (P=0.001). On the other hand, no significant correlation was found between M-ACT and age (P=1.00), sex (P=1.00), A/V thrombosis (P=0.43), while major bleeding (P=0.06), Hgb level (P=0.06) and JAK2 V617F burden>50% (P=0.059) showed a certain associative trend (Table 1).
We found that patients with M-ACT had a significant lower PFS than those without M-ACT (Table 1; Figure 2 panel A, for PFS: median PFS for M-ACT positive patients
58 months vs. median PFS for M-ACT negative patients 108 months, P<0.0001, hazard ratio [HR] 6.81, 95% Confidence Interval [CI]: 3.48-13.32). Moreover, JAK2 V617F allele burden ≥50% and history of major bleeding had a significant correlation with a worse PFS (P=0.0225 and P=0.0174, respectively, Online Supplementary Figure S1), while WBC count>11x109/L showed a certain trend toward significance (P=0.0823, Online Supplementary Figure S1). Conversely, age (P=0.3718), sex (P=0.3645), LDH serum level (P=0.1305), PLT count (P=0.5643), Hgb level
haematologica | 2021; 106(12)
3165
