
Page 144 - 2021_12-Haematologica-web
P. 144
M. Schino et al.
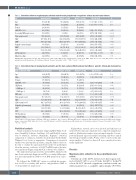
Table 1. Correlation between megakaryocytic activation and the main polycythemia vera patient’s clinical and molecular features.
PV
Age1
Male
Female
JAK2-RT > 50%
Secondary MF-progression Time-progression2
Hgb3
LDH4
Palpable splenomegaly WBC5
PLT6
A/V thrombosis
Major bleeding
Overall (n=64)
59.1 (40-74) 38 (59.4%) 26 (40.6%) 43 (67.2%) 41 (64.1%) 78.3 (26-116) 18.7 (15.2-19.9) 351.7 (210-522) 36 (56.2%) 11.3 (7.2-20.5) 590.8 (380-851) 24 (37.5%)
12 (18.7%)
M-ACT - (n=26)
59.3 (42-74) 15 (23.4%) 11 (17.2%) 16 (25.0%)
6 (9.4%) 95.5 (72-116) 16.2 (15.2-18.4) 241.3 (210-380) 16 (25.0%)
9.8 (7.2-13.4) 507.2 (380-623) 8 (12.5%)
1 (1.6%)
M-ACT + (n=38)
58.8 (40-73) 23 (35.9%) 15 (23.4%) 27 (42.2%) 32 (50%) 44.7 (26-48) 17.1 (15.4-19.9) 410.5 (238-522) 20 (31.3%) 15.6 (10.3-20.5) 720.4 (430-851) 16 (25.0%)
11 (17.2%)
HR [CI 95%]
1.00 [0.821 - 1.036] 1.01 [0.791 – 1.059]
1.24 [0.058 - 2.589]
2.87 [0.332-1.591]
2.78 [0.036-2.589]
1.31 [0.228-2.746]
1.54 [0.025-3.532]
1.83 [0.179-3.795]
1.81 [0.054-3.273]
2.39 [0.082-2.629]
1.02 [0.882 – 1.069]
1.54 [0.332-1.591]
P
1.00 1.00
0.059
0.0001
0.0001
0.06
0.002
0.001
0.001
0.0001
0.43
0.06
JAK2-RT: JAK2 V617F allele burden; Hgb: hemoglobin, serum levels; LDH: lactate dehydrogenase, serum levels; WBC: white blood cell count; PLT: platelet count; A/V: arterial/venous; HR: hazard ratio; CI: Confidence Interval. 1In years; 2In months; 3(g/dL); 4(UI/L); 5(x109/L); 6(x109/L).
Table 2. Correlation between megakaryocytic activation and the main early/prefibrotic primary myelofibrosis patient’s clinical and molecular fea- tures.
Early/prefibrotic PMF
Age1
Male
Female JAK2-RT > 50% CALR mut.
CALR type 1
CALR type 2
MPL mut. Time-progression2 Hgb3
LDH serum levels4 Palpable splenomegaly WBC5
PLT6
A/V thrombosis Major bleeding
Overall (n=199)
66.2 (46-78) 91 (45.7%) 108 (54.3%) 37 (18.6%) 60 (30.1%) 46 (23.1%) 14 (7.0%)
3 (1.5%) 67.3 (15-109) 15.3 (12.8-16.4) 402.7 (205-612) 111 (55.8%) 11.8 (7.5-18.7) 620.1 (366-861) 74 (37.2%)
30 (15.1%)
M-ACT - (n=109)
64.2 (48-76) 57 (28.6%) 52 (26.7%) 26 (13.1%) 19 (9.5%) 11 (5.5%) 8 (4.0%)
2 (1.0%)
70.2 (53-109)
14.8 (12.8-15.5)
230.3 (205-390)
49 (24.6%)
10.3 (7.5-14.8)
520.6 (366-650)
30 (15.1%)
14 (7.0%)
M-ACT + (n=90)
66.3 (46-78) 34 (17.1%) 56 (28.1%) 11 (5.5%) 41 (20.6%) 35 (17.6%) 6 (3.0%)
1 (0.5%)
33.7 (15-56)
15.2 (13.6-16.4)
407.9 (288-612)
62 (31.1%)
14.4 (9.9-18.7)
710.3 (490-861)
44 (22.1%)
16 (8.0%)
HR [CI 95%] P 1.01 [0.67078-1.036] 1.00
1.04 [0.872-1.055] 0.05
1.27 [0.073-2.879] 0.04 2.14 [0.301-1.902] 0.001
3.01 [1.527-3.812]
0.97 [0.833-1.056] 1.00 1.00 [0.663-1.044] 1.00
0.0001
2.83 [0.328-1.913]
1.04 [0.923-1.088] 0.43 1.54 [0.045-3.235] 0.003
1.82 [0.1797-3.759] 0.001 1.80 [0.045-3.733] 0.002
0.0001
2.46 [0.087-2.279]
0.0001
1.03 [0.243-1.912] 0.001
1.00 [0.928-1.079] 0.42
JAK2-RT: JAK2 V617F allele burden; CALR mut: CALR exon 9 mutations (type 1 + type 2); MPL mut: MPL exon 10 mutations; Hgb: hemoglobin: serum levels; LDH: lactate dehydro- genase, serum levels; WBC: white blood cell count; PLT: platelet count; A/V: arterial/venous; HR: hazard ratio; CI: Confidence Interval. 1In years; 2In months; 3(g/dL); 4(UI/L); 5(x109/L); 6(x109/L).
Statistical analysis
Statistical analysis was performed using GraphPad-Prism 5 soft- ware (Graph Pad Software, San Diego, CA) and MedCalc version 10.2.0.0 (MedCalc Software, Mariakerke, Belgium).25 Statistical comparison of continuous variables was performed by the Mann- Whitney U test (t-test), as appropriate. Comparison of categorical variables was performed by c2 statistic, using the Fisher’s exact test. In order to evaluate the agreement between the two pathologists about the presence or absence of M-ACT in BM biopsies, the inter- rater agreement (Kappa) using MedCalc software was calulated.
The endpoint was progression-free survival (PFS), defined as the time between the first diagnosis and PV-to-secondary MF progres- sion and early/prefibrotic PMF-to-overt PMF progression, respec- tively.
We followed the WHO 2017 criteria to establish the progres- sion for PV-to-secondary MF and for early/prefibrotic PMF to overt myelofibrosis progression.1
Kaplan-Meier survival curves were plotted and differences in survival between groups of patients were compared using the log- rank test. Multivariate analysis was performed using the Cox pro- portional hazards regression analysis including only those clinical and biological variables with a P-value of 0.10 or lower at the uni- variate analysis. P-values less than 0.05 were considered as statis- tically significant.
Results
Megakaryocytic activation in the polycythemia vera cohort
Twenty-six of the 64 PV did not meet histological crite- ria for M-ACT (40%), versus 38 who did (60%). In the PV cohort, M-ACT showed a significant correlation with one clinical parameter, i.e., palpable splenomegaly (P=0.001),
3164
haematologica | 2021; 106(12)
