
Page 110 - 2021_12-Haematologica-web
P. 110
F. Pozzo et al.
highly correlated with the mutational burden (rho=0.694, P<0.0001) (Figure 4C). This analysis also evidenced that the increase in altDVL2 was independent of the type of SF3B1 mutation, in terms of both mutational hotspot (Figure 4D) or amino-acid residue affected (Online Supplementary Figure S6D). Conversely, there was no sig- nificant difference between WT cases and cases bearing SF3B1 or NOTCH1 mutations in the expression of total DVL2 (Online Supplementary Figure S6E). Of note, we detected a low frequency of alternative splicing for DVL2 and the other genes also in WT cases (Online Supplementary Figure S6B, right inset), suggesting that the
altDVL2 form may be an underrepresented native splicing variation, particularly favored by a splicing machinery containing the mutated form of SF3B1.
Alternative splicing of DVL2 correlates with NOTCH1 signaling and CD20 expression
We then investigated whether altDVL2 could influence NOTCH1 signaling differently from wild-type DVL2. To do so, we overexpressed an exogenous DVL2, either wild- type or alternate, into a HEK293 NOTCH1-dependent luciferase reporter cell line; in this context, the transfec- tion of wild-type DVL2 but not of altDVL2 was able to
AB
C
D
E
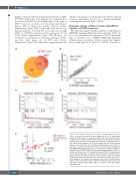
Figure 3. The NOTCH1 pathway is activated in SF3B1-mutated cases of chronic lymphocytic leukemia. (A) Venn diagram of the 1,274 differentially expressed known genes in NOTCH1-mutated (n=6) versus wild-type (WT) (n=13) cases and the 443 differentially expressed known genes in SF3B1- mutated (n=9) versus WT (n=13) cases. (B) Correlation of the fold change of 419 probes shared between the NOTCH1-mutated and the SF3B1-mutated signatures. The Spearman rank correlation coefficient (rho) and P-value are reported. (C, D) Gene set enrichment analysis enrichment plots tracking the HALLMARK_NOTCH_SIGNALING gene set, significantly enriched in NOTCH1- mutated (C) and SF3B1-mutated (D) chronic lymphocytic leukemia. NES: nor- malized enrichment score. (E) Correlation between NOTCH1 intracytoplasmic domain (NICD) expression, in arbitrary units, and SF3B1 or NOTCH1 variant allele frequency; the solid line represents the correlation within the SF3B1- mutated cases with the Spearman rank correlation coefficient (rho) and P- value reported; the dashed line represents the limit for NICD positivity, defined as the lowest NICD intensity within the NOTCH1-mutated cases (see also Online Supplementary Figure S5A). a.u.; arbitrary units; VAF: variant allele frequency.
3130
haematologica | 2021; 106(12)
