
Page 109 - 2021_12-Haematologica-web
P. 109
SF3B1 mutations and NOTCH1 activation in CLL
CLL-specific NOTCH1 signature,15 again suggesting the presence of an active NOTCH1 pathway; it is noteworthy that all ten datasets were included in the 11 datasets enriched in the NOTCH1-mutated cases.
Finally, using western blotting, we evaluated the expres- sion of the NOTCH1 intracytoplasmic domain (NICD), the cleaved active form of NOTCH1 in whole cell lysates of 34 CLL cases, of which 13 SF3B1-mutated among those with the highest mutational burden and seven NOTCH1-mutated cases. We detected a distinct NICD band in all CLL cases with mutations of NOTCH1, while the other samples showed a varying degree of NICD staining, in agreement with previous observations of NOTCH1 pathway activation independent of NOTCH1 mutations.15 To determine a cutoff for NICD positivity, we defined the threshold as the lowest densitometric intensity among NOTCH1-mutated samples (Figure 3E, dashed line). In agreement with GEP data, positive NICD staining could be detected in the majority (8/13) of SF3B1-mutated cases but in only 2/15 WT cases (Online Supplementary Figure S5A), in keeping with observations of a mutation-independent activation of the NOTCH1 path- way in CLL.15 The NICD intensity correlated positively with the mutational burden for both NOTCH1 and SF3B1 mutations further suggesting, for these events, a modulat- ing role on NOTCH1 signaling (Figure 3E) generally more elevated in NICD-positive samples, as determined by RT-
AB
qPCR of the NOTCH1 target genes DTX1 and CD300A (Online Supplementary Figure S5B).
SF3B1 mutations consistently induce alternative splicing of DVL2
In CLL, mutations of SF3B1 have been shown to induce transcriptome-wide splicing alterations in several genes including DVL2, a key component of the Wnt pathway, reported to act as a negative regulator of NOTCH1.36-40
Using next-generation sequencing in 73 primary CLL cases, we first evaluated SF3B1-induced splicing alter- ations of DVL2 (Figure 4A) and, as a control, two other highly differentially spliced genes, namely GCC2 and MAP3K7 (Online Supplementary Figure S6A).23 For all three genes, the exact reported splicing defects were highly enriched in all SF3B1-mutated cases (P<0.0001) (Online Supplementary Figure S6B) confirming that these alterations are highly consistent both within and between cohorts.
The expression of alternatively spliced DVL2 (altDVL2 hereafter) was then further investigated by RT-qPCR in a wider cohort of 222/537 CLL cases with available RNA, 35 of which with a SF3B1 mutation, 32 with a NOTCH1 mutation and 155 WT (Figure 4B). RT-qPCR results were highly concordant with next-generation sequencing data (rho=0.827, P<0.0001) (Online Supplementary Figure S6C). Expression of altDVL2 was significantly increased in the presence of SF3B1 mutations (P<0.001) (Figure 4B) and
C
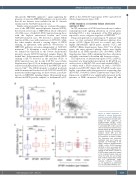
Figure 2. CD20 expression is reduced in chronic lymphocytic leukemia cases with SF3B1 muta- tions. (A) Expression of CD20 deter- mined by flow cytometry in SF3B1-mutated (SF3B1, n=42), NOTCH1-mutated (NOTCH1, n=47) or unmutated (WT, n=327) cases of chronic lymphocytic leukemia (CLL) without trisomy 12. MFI: mean fluo- rescence intensity. (B) Correlation between CD20 MFI and the CD20dim fraction in the whole cohort of non-trisomy 12 cases (n=416). The Spearman rank correlation coefficient (rho) and P-value are reported. (C) Percentage of the CD20dim fraction in SF3B1-mutated (SF3B1, n=42), NOTCH1-mutated (NOTCH1, n=47) or unmutated (WT, n=327) CLL cases. Right panel: per- centage of the CD20dim fraction in SF3B1-mutated cases with respect to the mutated hotspot. Data are shown by Tukey box and whisker plots. Outliers indicate data outside the 1.5 interquartile range. *P≤0.05, **P≤0.01, ***P≤0.001, n.s. not significant, as determined by a two-sided Mann-Whitney test.
haematologica | 2021; 106(12)
3129
