
Page 64 - 2021_10-Haematologica-web
P. 64
B. Cieniewicz et al.
AB
C
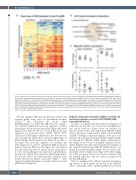
Figure 2. Sensitive and resistant pediatric acute myeloid leukemia have distinct gene expression profiles. (A) Two-dimensional heatmap of differentially expressed genes (DEG) identified between sensitive (S) and resistant (R) pediatric acute myeloid leukemia (pAML). DEG with a false discovery rate (FDR) <0.05 and absolute (log2 fold change [FC]) ≥2 were identified using differential gene expression analysis (DESeq2). Gene expression values were normalized with respect to the sensitive pAML group, by subtracting the mean expression of sensitive pAML. (B) Gene set enrichment in sensitive pAML. Gene ontology (GO) term enrichment was performed using Gene Set Enrichment Analysis and GO terms with FDR q<0.2 were visualized using EnrichmentMap in Cytoscape. Circle size is inversely scaled to the FDR q- value. (C) Sensitive pAML have high expression of mature myeloid markers. Top panels show bulk RNA sequencing (RNA-seq) log2 counts, and the bottom panels show the frequency of pAML expressing the indicated proteins, measured using clinical flow cytometry gated on blast cells. Error bars: median and interquartile range. *P<0.05. IR: intermediate resistant.
We next examined GO term enrichment in sensitive and resistant pAML using Gene Set Enrichment Analysis (GSEA).30,31 We visualized the results using EnrichmentMap28 to collapse the GO terms into sub-clus- ters. Sensitive pAML showed strong signatures of IFN-γ related genes and monocyte chemotaxis (Figure 2B; Online Supplementary Table S5). We also observed that the protein expression of monocytic genes (CD64, CD11c, CD4, CD15, and CD33) largely contributed to the observed vari- ance amongst the clinical flow cytometry phenotypes of pAML samples (Online Supplementary Figure S4). In order to investigate this monocytic signature, we visualized the gene expression of selected, established AML maturation markers4 from the RNA-seq data (Figure 2C, top) derived from the bulk bone marrow aspirate lysates, and matched it to the corresponding proteins expressed on pAML blasts, measured by clinical flow cytometry phenotyping (Figure 2C, bottom). CD11c and CD64 proteins, which are com- monly observed in mature, monocytic AML32,33 were expressed significantly higher in sensitive than in resistant pAML blasts (Figure 2C).
Pediatric acute myeloid leukemia (pAML) sensitivity and resistance signatures observed in NCI TARGET pAML transcriptome dataset
In order to determine if the gene expression signatures of sensitivity and resistance we observed in our pAML sam- ples can be found in a larger cohort, we analyzed our dataset together with a 187-sample NCI TARGET pAML dataset, the largest comprehensive pAML dataset publicly available.19 Principal component analysis on the most vari- ant genes showed that the Stanford pAML samples distrib- uted among the TARGET pAML samples, indicating that the sample source was not a dominant technical covariate (Online Supplementary Figure S5A). Unsupervised analysis of the combined Stanford and TARGET pAML datasets con- firmed that Stanford pAML samples did not cluster inde- pendently (Online Supplementary Figure S5B). Interestingly, out of the four major clusters, two clusters contained only the S pAML while the other two clusters contained both the IR and R pAML.
Next, we examined if the 335-gene signature discriminat- ing between S and R pAML was present in the TARGET dataset. Clustering of the combined pAML dataset based
2592
haematologica | 2021; 106(10)
