
Page 40 - 2021_10-Haematologica-web
P. 40
S. Hultmark et al.
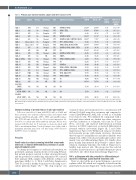
Table 1. Primary acute myeloid leukemia samples and their response to H4.
% CD11b or CD11b and CD15*
Sample Subtype
AML-1 M4 AML-2 M2 AML-3 M5 AML-4 M1 AML-5 M0 AML-6 Unspecified AML-7 Unspecified AML-8 M5 AML-9 M5 AML-10 M5 AML-11 M5 AML-12 (PDX) M4 AML-13 M1 AML-14 M1 AML-15 M3 AML-16 M0 AML-17 NOS AML-18 MD AML-19 M2 AML-20 M1
Relapse Karyotype FLT3
Yes Normal ITD No Normal WT Yes Complex WT No Normal ITD No Normal WT No Complex WT No Complex WT No Normal ITD NK NK WT NK Normal Mut No NK Mut No Normal WT NK Normal WT NK Complex WT NK Normal Mut Yes Normal WT NK Normal ITD NK Normal WT NK Normal ITD No NK ITD
Additional mutations
DNMT3A, NPM1
NPM1, TET2
TP53
DNMT3A, NPM1
DNMT3A, IDH1, NOTCH1, SRSF2 TP53, RUNX1, NRAS
NPM1, IDH2, RUNX1, PHF6 DNMT3A, NPM1, SMC3, PTEN NI
DNMT3A, NPM1, TET2 CEBPA
NPM1, DNMT3A, IDH2
NI
DNMT3A
NPM1, CEBPA, PML-RARA TP53, DNMT3A, STAG2 TET2, KRAS, WT1
NPM1, CEBPA NI
NI
NA NA
NA
DMSO
23.2%* 31.4%* 20.8% 14.6%* 14.8%* 65.2% 28.3%* 23.1% 15.9%* 28.8% 25.4% 64.3% 22.3% 38.8% 21.5% 69.8% 78.5% 76.3% 44.8% 64.5%*
11.6% 12.7%
32.5%
H4 10 mM 23.8%*
47.4%* 62.9% 19.0%* 7.6%* 73.1% 57.7%* 34.9% 45.0%* 29.6% 35.2% 75.5% 25.0% 64.4% 29.3% 72.4% 78.3% 86.9% 47.6% 72.5%*
18.0% 18.3%
24.9%
Cell #/ DMSO
1.39 0.88 0.73 1.02 0.62 0.04 0.64 1.18 0.73 0.69 0.49 0.82 1.09 0.22 1.03 0.66 0.13 0.25 0.48 0.94
1.06 0.32
1.18
MFI FSC-A & SSC-A/ DMSO
1.02 / 0.98 0.95 / 1.00 1.09 / 1.27 0.89 / 0.78 0.82 / 0.89 0,.86 / 1.15 0.91 / 0.77 1.02 / 1.01 0.97 / 1.05 0.96 / 0.90 0.98 / 1.30 0.97 / 0.98 1.02 / 1.00 0.93 / 1.06 1.01 / 1.11 0.97 / 1.03 0.80 / 0.81 0.93 / 0.88 1.00 / 0.94 0.91 / 0.94
1.03 / 1.09 1.01 / 0.99
1.98 / 0.99
Ctrl UCB (MNC)
Ctrl UCB (CD34+ MNC)
Ctrl BM
(CD34+ MNC)
NA NA NA NA
NA NA
NA NA NA NA
NA NA
AML: acute myeloid leukemia; DMSO: dimethylsulfoxide; MFI: mean fluorescent intensity; SSC: side scatter; FSC: forward scatter; ITD: internal tandem duplication; WT: wild-type; Mut: mutated; NK: not known; NI: not identified; NA: not applicable; PDX: patient-derived xenograft; Ctrl: healthy control; UCB: umbilical cord blood; MNC: mononuclear cells; BM: bone marrow.
Immunostaining of protein kinase C phosphorylation
Cells were treated for 30 min with H4 10 mM or 40 mM and then cytospun onto polysine adhesion slides and stained with primary anti-PKCα phospho S657 + Y658 and anti-PKCe phos- pho S729 (Abcam) antibodies for 1 h at room temperature fol- lowed by secondary anti-rabbit antibody (Abcam). Nuclei were stained with Hoechst for 5 min and sections mounted with Dabco mounting medium. Confocal images were taken with a maximum intensity projection of 5 mm using a 63X objective (LSM780, Zeiss, Germany).
Results
Small natural product screening identified compounds with toxic or myeloid differentiation potential on acute myeloid leukemia cells
To identify novel targets for combinatorial treatment, we performed a primary small molecule screen using 513 puri- fied natural products selected for their structural diversity and the potential for further drug refinement. We screened three primary AML samples with different subtypes and genotypes (AML-1 to -3; Table 1 and Online Supplementary Table S1) as well as healthy bone marrow cells using our co- culture platform (Figure 1A).17,21 The drug response was
evaluated 4 days after treatment at two concentrations (0.5 mM and 10.0 mM) using flow cytometry and compared to control (DMSO-treated) AML cells as well as to healthy bone marrow cells. We identified 44 compounds with a biological effect which we divided into three categories: cytotoxic (reduction of volumetric cell count by at least 50%), cytotoxic and myeloid differentiation potential (increase in CD11b expression) or myeloid differentiation potential without cytotoxicity (Figure 1B, C and Online Supplementary Figure S1A). Within each category, we identi- fied molecular groups with similar structures. Molecules that belonged to amaryllidaceae and indole alkaloids were mainly toxic, while rotenoids and cardiac glycosidases were mainly toxic and differentiating (Figure 1C). Finally, diter- penes mainly demonstrated the potential to induce differ- entiation of primary leukemic cells without being toxic to healthy bone marrow cells. This group was thus selected for further characterization as a potential therapeutic option with fewer side effects than chemotherapy (Figure 1C).
H4 is a diterpene with the potential to differentiate pri- mary FLT3 wild-type acute myeloid leukemia cells
Next, we selected the most potent diterpene, a novel jat- rophane called H4, which was originally isolated from the plant Euphorbia paralias (Figure 2A).22 In the initial screen, H4
2568
haematologica | 2021; 106(10)
