
Page 236 - 2021_10-Haematologica-web
P. 236
Letters to the Editor
tively, and high EPOR expression (Table 1). Moderate CRLF2 overexpression was detected without CRLF2 rearrangement and was attributed to hyperdiploidy with +X. ArcherDX FusionPlex and NGS analysis demonstrat- ed IGH-EPOR rearrangement and subclonal KRASG12D mutation. The patient received four-drug induction chemotherapy on the COG AALL1131 trial with end- induction FC MRD 5.7%. She received post-induction chemotherapy with ruxolitinib 50 mg/m2 twice-daily for 14-days-on/14-days-off/month (DL2) on the COG AALL1521 phase II clinical trial7 and achieved remission with end-consolidation MRD <0.01% and end-interim maintenance 1 MRD 0%. Chemotherapy-associated complications included methotrexate-associated neuro- toxicity with successful intrathecal chemotherapy rechal- lenge, pulmonary nodules treated with posaconazole, malnutrition requiring supplemental nasogastric feeding, and humeral avascular necrosis requiring discontinuation of prednisone chemotherapy in maintenance cycle 5. She remains in clinical remission on the AALL1521 trial with
end-of-therapy in June 2021. Her diagnostic ALL speci- men was not available for PDX modeling.
Patient #3 (H25648): A 17 year-old Caucasian female was diagnosed with NCI HR B-ALL in February 2019 with WBC 78,000 with 82% peripheral blasts. CSF was negative for leukemia (CNS1). Cytogenetics were normal with 46,XX. RNA-sequencing identified an IGH-EPOR rearrangement with confirmed high EPOR expression by reverse transcriptase-PCR and high EPOR surface protein expression by FC (Figure 1A). She had a poor prednisone response8 (9730 blasts/mm3 peripheral blood after 7 days’ therapy) and was thus classified as high-risk, received a four-drug induction on the CAALL-F01 phase III trial (clinicaltrials gov. Identifier: NCT02716233), and was refractory at end-induction with MRD 15%, as measured by immunoglobulin/T-cell receptor rearrangement PCR assay (Figure 1B). She was removed from study and received consolidation therapy with cyclophosphamide, cytarabine, 6-mercaptopurine, and ponatinib 45 mg daily for 14 days based upon in vitro phosphoflow cytometry
AB
CD
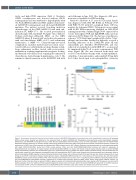
Figure 1. Assessment of potential tyrosine kinase inhibitor activity in IGH-EPOR Philadelphia chromosome-like acute lymphoblastic leukemia. (A) Increased EPOR surface protein staining was detected in the leukemia blasts of patient H25648 with Philadelphia chromosome-like acute lymphoblastic leukemia (Ph-like ALL) and IGH-EPOR re-arrangement versus other B-acute lymphoblastic leukemia (B-ALL) cases (n=174) sequentially analysed at the Hôpital Robert Debré flow cytometry laboratory as research testing outside of the CAALL-F01 clinical trial. MFI: mean fluorescence intensity. Clinical flow cytometry analysis was performed on a FACS Canto II flow cytometer and analyzed with DIVA software (version 8.0.2; Becton-Dickinson) and demonstrated an immunophenotype profile with bright CD10/CD19/CD20, partial dim CD34, partial positive CD22, and dim CD24/CD58/CD38/CD123 staining with aberrant expression of CD21/CD25/CD27 and absence of myeloid markers CD11b/CD13/CD33/CD66c (not shown). (B) Clinical minimal residual disease levels in patient H25648 during chemotherapy (induction and consolidation; grey bars), ponatinib (blue bars; bar height bars depicts relative ponatinib dosing), and immunotherapy (bli- natumomab; orange bar) and allogeneic hematopoietic stem cell transplantation (HSCT; black arrow) showed initial chemoresistance and subsequent measur- able residual disease (MRD)-negative remission following blinatumomab therapy with continued ponatinib therapy that was also utilized subsequently at lower dosing as post-HSCT maintenance therapy. Dashed grey line shows undetectable MRD threshold. (C) In vitro exposure of fresh primary ALL cells from patient H25648 to various tyrosine kinase inhibitors (TKI) at the indicated concentrations for 72 hours at 37°C resulted in potent inhibition of phosphorylated pan-tyro- sine and STAT5Y694 by phosphoflow cytometry (performed on a Navios flow cytometer) gated on CD45+/CD19+ blasts using Kaluza software (version 2.1; Beckman Coulter). Data are shown as percent inhibition (green-to-purple) of normalized basal phosphoprotein levels (yellow) with TKI exposure via colorimetric heatmap display. (D) In vitro viability of Ficoll-separated diagnostic primary bone marrow ALL cells from patient H25648 with ponatinib or ruxolitinib exposure was assessed via MTT (3-(4,5-di methylthiazol-2-yl)-2,5-diphenyltetrazolium bromide) assay. Data analysis and display were performed in Prism.
2764
haematologica | 2021; 106(10)
