
Page 61 - 2021_09-Haematologica-web
P. 61
NOTCH1 mutations in CLL
P=0.031, Online Supplementary Figure S10A and B) and with lower BAX/BCL-2 ratio (60% vs. 97% and 72% vs. 94% at 3 years, respectively; P=0.019 and P=0.013, Figure 3A and B). Therefore, higher or lower BAX/BCL-2 ratio combined with NOTCH1 WT or NOTCH1 M identified two subsets of patients, the former with the best prognosis and the lat- ter with the worst prognosis with respect to both PFS (97% vs. 42%; P=0.0002, Figure 4A) and OS (94% vs. 63%;P=0.005, Figure 4B), confirming the true additive prog- nostic properties of these two prognosticators.
Multivariate analysis
The clinical impact of NOTCH1 as independent prog- nosticator was checked by multivariate Cox proportional hazards analysis applied to models including two other prognosticators proven to be significant in univariate analysis (Table 2). With respect to PFS, NOTCH1 M (P=0.0002) were confirmed as an adverse independent prognostic factor (P=0.00006) together with >2 previous lines of therapy (P=0.004) and TP53 M (P=0.028) (Table 3). Similarly, in a multivariate analysis of OS, NOTCH1 M retained an independent prognostic value (P=0.0039)
together with >2 previous lines of therapy (p=0.015) and TP53 M (p=0.047) (Table 3). NOTCH1 M and >2 previous lines of therapy were confirmed as independent prognos- ticators for PFS (P=0.035 and P=0.015, respectively) also in a model that included the BAX7BCL-2 ratio, available in a smaller subset of cases (n=113, Online Supplementary Table S6). Conversely, in the same subset of patients, no factor emerged as independent prognosticator for OS (Online Supplementary Table S6).
Discussion
In the present study we evaluated the efficacy of ibrutinib treatment in the high-risk NOTCH1 M CLL group and cor- related NOTCH1 M to BAX/BCL-2 ratio, a value reflecting the susceptibility of cells to apoptosis. Efficacy of ibrutinib remained high at 4-year follow-up in almost all pre-treated patients with CLL, with 71% of patients alive and progres- sion free, similarly to other studies.17 Moreover, ibrutinib was more effective in patients previously treated with only one line therapy, compared to patients previously treated
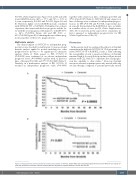
A
B
Figure 2. Progression-free survival and overall survival curves based on NOTCH1. Kaplan-Meier plot comparing progression-free survival (PFS) (A) and overall sur- vival (OS) (B) based on NOTCH1. NOTCH1 mutated (NOTCH1 M) patients experienced both a shorter PFS and OS.
haematologica | 2021; 106(9)
2349
