
Page 60 - 2021_09-Haematologica-web
P. 60
G. Del Poeta et al.
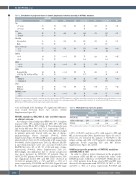
Table 2. Distribution of prognostic factors in chronic lymphocytic leukemia according to NOTCH1 mutations NOTCH1
Parameter
Age
<60 years
>60years
Sex
Mod-Rai Intermediate High
Lines of therapy ≤2
>2 CD49d
<30%
>30%
CD38 <30%
>30% FISH
Normal/del13q
+12, 11q-,17p- del11q, del17p)
IGHV
Mutated Unmutated
TP53
Mutated Wild-type
BAX/BCL-2 ratio <1.5
Mutated Wild-type P¶ 31 54 0.52
34 61
n§ 4-year OS,% P* 4-year PFS, % P* 180 85 0.29 81 0.72
95 89
Male Female
45 77 0.44 180 122 20 38 58
10 30 0.32 180 140 55 85 40
0.71
0.81
115 0.55 55
40 0.33 130
55 101 0.54 180 156
10 14 24 22
0.004
148 0.002
14 57 51 57
11 48 27 27
24 46 41 68
14 38 48 75
23 43 40 72
40
35
0.0001 0.0004
0.0002 0.080
0.52
0.0001
179 113
179 175
178
113
71 0.23
108 101
52 0.76
123 117
68 0.045
59 0.52
54 50
56 0.36
71 0.49
107 98
70 0.46
48 0.036
34 >1.5 4
66 0.028 112
74 0.013
59 0.022 109
0.0019
67 39 39
¶ Fisher exact tests were performed to evaluate the association between NOTCH1 mutations or wild-type and other prognostic factors. § Values refer to the number of cases analysed for a given feature. *P-values were calculated by the log-rank test in univariate analysis. PFS: progression-free survival; OS: overall survival; FISH: fluorescence in situ hybridisation; IGHV: immunoglobulin heavy-chain variable region gene.
tosis and lymph node shrinkage. No significant differences were found between these two subsets (Online Supplementary Figure S3).
NOTCH1 mutations, BAX/BCL-2 ratio and their impact on clinical outcome
According to clinical endpoints, ORR was 91% [complete response (CR): 18%, partial response (PR): 28%, PR with lymphocytosis (PR-L): 45%] (Table 1). The estimated 2-year and 4-year OS were 84% and 71%, respectively (Table 1; Online Supplementary Figure S4). Noteworthy, OS was longer in patients previously treated with one line of chemo- immunotherapy before ibrutinib (P=0.02, Online Supplementary Figure S5). PR and PR-L were significantly cor- related with NOTCH1 M (30 of 65 and 22 of 65, respectively; P=0.00001,OnlineSupplementaryTableS4).Ofnote,PR,PR- L and chemoresistance were also associated with lower BAX7BCL-2 ratio (23 of 29, 33 of 52 and nine of nine, respectively; P=0.002, Online Supplementary Table S5). Interestingly, discontinuation due to disease progression was more frequent in NOTCH1 M patients than in NOTCH1 WT patients (P=0.034, Online Supplementary Table S4). Significant shorter PFS and OS were observed in NOTCH1 M patients (34% vs. 76% and 56% vs. 83% at 3 years, respectively; P=0.00002 and P=0.001; Figure 2A and B). There were no significant differences among VAF range
Table 3. Multivariate Cox regression analysis
Parameter
PFS 168 patients
OS
178 patients
HR
HR
1-10%, 10.5-20% and above 20% with respect to PFS and OS,asshownintheOnlineSupplementaryFiguresS6andS7. Moreover, we restricted the analysis of NOTCH1 to the relapse setting only (154 of 180 patients) obtaining similar significant results regarding PFS and OS (Online Supplementary Figures S8 and S9).
Additive prognostic properties of NOTCH1 mutations and BAX/BCL-2 ratio
In order to obtain a better refinement in the prognostic assessment of PFS and OS, we combined the values of the BAX/BCL-2 ratio with those of NOTCH1. Within the sub- set of 113 patients from Rome, shorter PFS and OS were detected both in patients with NOTCH1 M (46% vs. 83% and 68% vs. 86% at 3 years, respectively; P=0.0019 and
NOTCH1 M 3.89
>2 lines of therapy 2.88
TP53 M 2.05
PFS: progression-free survival, OS: overall survival: M: mutant; HR: hazard ratio.
P
P
0.00006 0.0040 0.028
2.64 2.43 1.94
0.0039 0.015 0.047
2348
haematologica | 2021; 106(9)
