
Page 237 - 2021_09-Haematologica-web
P. 237
Letters to the Editor
cells post-ASCT (Online Supplementary Figure S3C). NK- cell CD107a degranulation (although lower) was not sig- nificantly different in NDMM patients compared to HD at the post-induction or ASCT timepoints (Online Supplementary Figure S3D). These findings reveal an apparent separation between NK-cell degranulation and
effective cytotoxicity against myeloma cells (but not against K562). This was previously observed in a model system where phospholipase γ2 signaling was impaired,12 and also when adhesion was impaired between effector and target cells.10 No apparent differences were observed in the level of cytokine TNF and chemokines (CCL3,
A
B
C
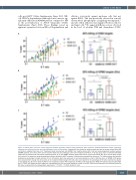
Figure 3. Natural killer cells from newly diagnosed multiple myeloma patients show significantly lower myeloma antibody-dependent cellular cytotoxicity response post-induction therapy and post-autologous stem cell transplant. A standard 4-hour chromium release assay was used to assess natural killer (NK) cell function, adapted from Hsu et al.5 Peripheral blood mononuclear cells (PBMC) from healthy donors (HD) (n=8) and newly diagnosed multiple myeloma (NDMM) patients at the time points end of induction (EOI) and post-autologous stem cell transplant (post-ASCT), n=10 per group, were co-cultured with K562 target cells to determine NK cell natural cytotoxicity levels (A), or with OPM2 myeloma target cells and 10 μg/mL elotuzumab (Elo) (B) or human IgG1 isotype (iso) control (C) to determine antibody-dependent cellular cytotoxicity (ADCC) capacity. Cytotoxicity was assessed by chromium (51Cr) release assays and the data displayed as percentage of target cell lysis (A to C, left panels). Each line represents a non-linear regression curve for HD (blue line), or NDMM at EOI (green line) and post-ASCT (orange line) time points at the indicated effector:target (E:T) cells ratios (normalized for the percentage of NK cells). Inserted bar graphs on the right for (A), (B) and (C) show the NK E:T ratio required to achieve 40% target lysis (A, K562), 20% target lysis (B, OPM2 with elotuzumab) and 10% target lysis (C, OPM2 with isotype control) target lysis, extrapolated from the non-linear regression curves on the left. Each symbol represents an individual patient or HD. Data are pooled from five independent experiments. **P<0.01, * P<0.05, Student’s t-test.
haematologica | 2021; 106(9)
2525
