
Page 212 - 2021_09-Haematologica-web
P. 212
Letters to the Editor
ABC
DE
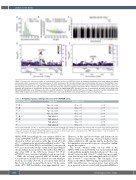
Figure 1. Genome-wide association studies of erythropoietin plasma levels in the SKIPOGH cohort. (A) Histogram distribution of the mean values of duplicate erythropoietin (Epo) measurements in the blood plasma of 1,006 participants. (B) Correlation between Epo and hemoglobin (Hb) levels in the SKIPOGH cohort. (C) Manhattan plot showing the –log10 (P-value) of the association between Epo plasma levels and 6.4x10⁶ single-nucleotide polymorphisms (SNP) in 872 sam- ples following correction for sex, age and center. The blue line shows the indicative suggestive threshold of P<10–5. Markers are ranked by chromosome and positions. The green dot on chromosome 6 shows the top SNP at the HBS1L-MYB locus, and the green dot on chromosome 15 shows the top SNP at the MAP2K5-SKOR1-PIAS1 locus. (D) Region around the top SNP rs413451 in the MAP2K5-SKOR1-PIAS1 locus. (E) Region around the top SNP rs9402685 in the HBS1L-MYB intergenic locus which is the reference SNP found in our study. SKIPOGH: Swiss Kidney Project on Genes in Hypertension.
Table 2. Heritability of plasma erythropoietin levels in the SKIPOGH cohort.
Variance components
P* - M - S P* - M
Adjustment
Age, sex, center Age, sex, center
Heritability ± SD
0.40 ± 0.07 0.41 ± 0.07
P
<0.001 <0.001
P* - S Age, sex, center 0.39 ± 0.07 <0.001 P* Age, sex, center 0.40 ± 0.06 <0.001
P* - M - S Fully adjusted 0.51 ± 0.08 <0.001 P* - M Fully adjusted 0.52 ± 0.07 <0.001
P* - S Fully adjusted 0.48 ± 0.07 <0.001 P* Fully adjusted 0.49 ± 0.06 <0.001
Shown is the heritability of ln(Epo) ± standard deviation. Narrow sense heritability was estimated from family data using the ASSOC program in the Statistical Analysis in Genetic Epidemiology software package (Case Western Reserve University). SKIPOGH: Swiss Kidney Project on Genes in Hypertension; Epo: erythropoietin; SD: standard deviation; P: polygenic; M: marital; S: sibling. Fully adjusted: age, sex, center, current smoker (yes/no), hemoglobin level, eGFR (ckd-epi formula). *Only the polygenic com- ponent of the variance was significantly different from 0 in all models.
HBS1L-MYB. Interestingly, the top common SNP of our study (rs9402685) and the associated HBS1L-MYB locus showed a robust association with Epo levels (P=1.46 x10⁻⁴), confirming the previously published results.4 The SNP rs1617640 of the EPO locus itself has been reported to be associated with low Epo serum levels in predialysis chronic kidney disease patients,9 but neither this SNP nor any other SNP of the EPO locus (lowest P=0.17 at rs7789679) were associated with Epo levels in our study.
While the recently reported SNP rs1130864 of the C-reactive protein (CRP) locus did not associate with Epo levels in our study (P=0.69), it associated with altered Epo levels in dried neonatal blood spots.10 In the same study, EPO SNP heritability was approximately zero.
However, at this age blood volume and hematocrit are different from the adult stage, the liver-to-kidney switch of Epo synthesis is still ongoing, and the method for Epo determination was much less precise, altogether explain- ing the discrepancy.
The result obtained with our top SNP of the HBS1L-MYB locus (rs9402685) was meta-analyzed with results publicly available from Beverborg et al.4 The com- bined P-value reached 1.78x10⁻²³, which was more signif- icant than in any of the two individual studies (1.46x10⁻⁴ and 1.09x10⁻²⁰, respectively). The intergenic locus between the HBS1L (GTP-binding elongation factor) and MYB (myeloblastosis oncogene) genes had previously been reported to be associated with deregulated HbF in a
2500
haematologica | 2021; 106(9)
