
Page 211 - 2021_09-Haematologica-web
P. 211
Letters to the Editor
Heritability and association with distinct genetic loci of erythropoietin levels in the general population
Erythropoietin (Epo)-regulated red blood cell (RBC) homeostasis is crucial for oxygen delivery in vertebrates, and Epo over- or under-production causes erythrocytosis or anemia, respectively. Plasma Epo levels are usually very low and characterized by circadian fluctuations and strong induction upon acute exposure to low oxygen conditions such as inspiratory hypoxia or blood loss. Considering the high prevalence of various forms of ane- mia worldwide as well as the fact that the majority of erythrocytosis cases are of unknown origin, surprisingly little is known about the genetic determinants of circulat- ing Epo levels. While a number of genome-wide associa- tion studies (GWAS) could link RBC traits such as RBC size, hemoglobin (Hb) content and hematocrit levels to single-nucleotide polymorphisms (SNP), only few studies analyzed circulating Epo levels. Some specific studies focused on aging populations with gradually decreasing renal function,1 Epo levels after kidney transplantation,2 or the (lack of) sex-specific differences in chronically ane- mic patients.3 However, none of these initial analyses have been performed in a population-based cohort which would have the advantage of a high external validity of the findings. A first GWAS with circulating Epo levels was performed in a large (6,984 participants) non-family- based Dutch cohort.4 Epo values were obtained from 6,777 participants and 2,691 were used for GWAS which identified a locus comprising the HBS1L and MYB genes as most likely targets, but no replication cohort was avail- able for validation by an independent study.
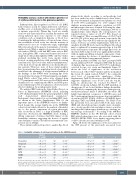
We analyzed RBC traits in the Swiss Kidney Project on Genes in Hypertension (SKIPOGH) cohort, including 1,109 adult participants from the general population with well characterized physiological parameters.5 Participants' characteristics by sex, including RBC traits, are shown in the Online Supplementary Table S1. An important aspect of the SKIPOGH cohort is its family- based design (the average family size in the SKIPOGH cohort is four) which allows for the analysis of heritabil- ity, i.e., the genetic component of a given phenotypic trait. As shown in Table 1, a high heritability of RBC traits was observed in the SKIPOGH cohort. Adding a sibling component of variance had little impact on the heritability estimates, suggesting the absence of signifi- cant dominance variance and shared environmental com- ponents across siblings.
These initial results motivated us to analyze Epo blood
plasma levels which, according to our knowledge, had not been studied in such a family-based cohort before. Epo was determined in heparin-treated plasma of a total of 1,066 (96%) participants. For 1,020 samples both duplicate measurements (replicate correlation, r=0.998) and phenotypic data were obtained. Following the elimi- nation of 14 extreme outliers, the remaining 1,006 (91%) unadjusted Epo values (Figure 1A) corresponded to the reported reference values of 2.8-17.9 IU/L (based on 2,506 samples).4 Over a normal Hb range of 135-175 g/L and 120-155 g/L for men and women, respectively, the range of Epo was 4-24 IU/L without any significant dif- ference between sex (Online Supplementary Table S1). A quadratic fit with Hb levels was found (Figure 1B), which may be explained by anemia-responsive Epo at low Hb levels and hormone-responsive Hb at high Epo levels. As shown in Table 2, Epo levels were significantly heritable, without significant sibling or marital components of vari- ance, suggesting the absence of significant dominance variance and shared environmental variance.
We next perfomed a GWAS of 2.5x10⁶ genotyped SNP and an additional 4.0x10⁶ of imputed SNP with the mean of duplicate Epo measurements of 872 (79%) individuals, corrected for age, sex, center and familiarity. Figure 1C shows the level of significance of the association between each of the 6.5x10⁶ markers and the normalized Epo levels. No signal reached P<5x10⁻⁸, the commonly used level of genome-wide significance (Online Supplementary Table S2). However, a few SNP fell into the suggestive significance zone (P<10-5) and the top hit, lying on chromosome 15, reached P=1.05x10⁻⁷ at rs413451. As shown in Figure 1D, the SNP identified on chromosome 15 are located within a linkage disequilibri- um (LD) block comprising the last exons of mitogen-acti- vated protein kinase kinase 5 (MAP2K5), the whole SKI family transcriptional corepressor 1 (SKOR1) gene and the 5' upstream and promoter regions of protein inhibitor of activated STAT1 (PIAS1). PIAS1 is a SUMO E3 ligase affecting STAT1 and NFκB pathways. The PIAS1 locus has previously been associated with body mass index (BMI) and related phenotypes (weight, waist circumfer- ence, obesity, predicted visceral adipose tissue), as well as smoking-related phenotypes (initiation age, smoking sta- tus) and age at menarche.6-8 According to the MR-Base PHEWAS database in the UK Biobank cohort several RBC-related phenotypes were also associated with the MAP2K5-SKOR1-PIAS1 locus, further suggesting that it could be directly associated with Epo levels.
Figure 1E shows the significance of the association for the SNP present at the previously associated locus
Table 1. Heritability estimates of red blood cell indices in the SKIPOGH cohort.
Hemoglobin Hematocrit RBC count MCV
MCH MCHC RDW
0.40 ± 0.05 0.37 ± 0.06 0.50 ± 0.05 0.68 ± 0.04 0.63 ± 0.05 0.60 ± 0.06
0.38 ± 0.07
0.52 <1.0x10⁻⁷ 0.57 0.001 0.67 <1.0x10⁻⁶ 0.59 <1.0x10⁻⁷ 0.52 <1.0x10⁻⁵ 0.94 <1.0x10⁻⁵ 0.20 <0.001
0.37 ± 0.06 0.52 0.33 ± 0.07 0.57 0.47 ± 0.06 0.66 0.68 ± 0.05 0.59 0.61 ± 0.06 0.51 0.46 ± 0.06 0.93 0.36 ± 0.08 0.20
Model 1 Model 2
h2±SEM l P h2±SEM l
P
<1.0x10⁻⁷ <1.0x10⁻⁷ <1.0x10⁻⁷ <1.0x10⁻⁷ <1.0x10⁻⁵ <1.0x10⁻⁷ <0.001
Models are adjusted for age, sex and center. Model 1, no sibship component of variance; model 2, including a sibship component of variance (which captures dominance genetic variance and shared environmental components between siblings). l, power transformation: (l = 0) and (l = 1) correspond to log and no transformations, respec- tively. SKIPOGH: Swiss Kidney Project on Genes in Hypertension; RBC: red blood cell; MCV: mean corpuscular volume; MCH: mean cell hemoglobin; MCHC: mean corpus- cular hemoglobin concentration; RDW: red blood cell distribution width; h2: heritability; SEM: standard error of the mean.
haematologica | 2021; 106(9)
2499
