
Page 202 - 2021_09-Haematologica-web
P. 202
Letters to the Editor
α/β-globin imbalance leading to clinically-significant dis- ease). For each patient, data were retrieved for gender, age at last observation, status (living or dead) at last observation and eventual cause of death. Data was also gathered on whether the patient was transitioned to a regular transfusion program (and the date) or started receiving iron chelation therapy (and date).
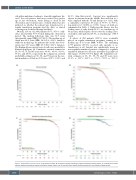
Overall, 113 out of 2,033 patients (5.6%, 95.0% confi- dence interval [CI]: 4.6-6.6) died during the observation period. The median follow-up time was 33.9 years (interquartile range [IQR]: 23.7-46.8). The median age at death was 46.3 years (IQR: 28.3-61.9; 43.4% females), while the median age for patients alive at the last obser- vation was 33.7 years (IQR: 23.7-45.9; 52.4% females). The Kaplan-Meier survival curve for all-cause mortality is illustrated in Figure 1A. Cumulative survival estimates at 18, 50, 65, 75, and 85 years were 99.4%, 93.4%, 81.8%, 66.2%, and 25.4%, respectively. By comparison, survival probability estimates at 50, 65, and 75 years in the nor- mal population of Italy in 2019 were 98.5%, 94.0% and
82.9% (http://dati.istat.it/). Survival was significantly shorter in patients from the Middle East and Asia (n = 922) compared with the US and Europe (n = 1111), with a cumulative survival at 50 years of 74.9% vs 96.3%; Log-rank test χ2: 82.581, p <0.001). Causes of death are summarized in Table 1. Cardiovascular disease was the leading cause of early death (36.3%, at a median age of 34.2 years), while hepatic disease was the leading cause of death in older patients (20.4%, at a median age of 55.4 years).
A subset of 254 patients (12.5%) were eventually placed on regular transfusion programs, starting at a median age of 10 years (IQR: 4-28.3). The remaining 1,779 patients (87.5%) received only sporadic or no transfusions at all. Survival was significantly worse in non-regularly transfused patients compared to regularly transfused patients for all-cause mortality (Log-rank test Chi-square: 13.298, P<0.001, Figure 1B). Cumulative sur- vival estimates at 18, 50, 65, 75, and 85 years were 99.3% vs. 100%, 92.6% vs. 97.1%, 79.5% vs. 95.0%,
AB
CD
Figure 1. Kaplan-Meier survival curves. (A) all-cause mortality, (B) all-cause mortality according to regular transfusion therapy status, (C) mortality from cardio- vascular disease according to regular transfusion therapy status, and (D) mortality from hepatic disease according to iron chelation therapy status.
2490
haematologica | 2021; 106(9)
