
Page 154 - 2021_09-Haematologica-web
P. 154
M. Germeshausen and M, Ballmaier
CD110 expression on hematopoietic progenitors
We analyzed the expression of the MPL encoded pro- tein CD110 on CD34+CD38lo hematopoietic progenitors25 from 30 CAMT-MPL patients and eight healthy donors (Figure 2). There was a clear correlation between real CD110 expression and the predicted effects from the mutation analysis on the one hand and between CD110 expression and clinical course on the other hand: CD110 expression was not measurable on cells from patients with nonsense or frame shift mutations and mutations predicted to lead to a complete loss of a splice site (Figure 2, group A). In the group of patients with missense muta- tions we observed more variation in CD110 surface expression (Figure 2, group B) which was correlated with clinical courses: the higher CD110 expression observed in two patients homozygously affected by p.Asp295Tyr (Figure 2, violet squares) was correlated with a less severe course (CAMT101 and CAMT102). Cells from the patient with the p.Arg454Pro mutation predicted to be benign showed a nearly normal surface expression of CD110 (Figure 2, green square). In contrast, in patients with the mutation p.Arg102Pro (homozygous or com- pound heterozygous with a null mutation) and a relative
severe course we measured a very low CD110 signal (Figure 2, blue squares).
Thrombopoietin plasma levels
Plasma levels of thrombopoietin are inversely propor- tional to the total mass of functional MPL in the body due to a direct negative feedback loop. Healthy donors usual- ly have thrombopoietin plasma levels below 30 pg/mL (range <30-196 pg/mL). In contrast, thrombopoietin plas- ma levels were markedly elevated in all samples from 40 patients in this study and ranged from 400 to >4,000 pg/mL (median 1,493 pg/mL; Online Supplementary Table S1). Within the group of CAMT-MPL patients we did not find a significant correlation between THPO levels and either MPL expression levels on early hematopoietic pro- genitors or severity of the disease, but patients predicted to have a total receptor deficiency had a higher median thrombopoietin level (median 1,685 pg/mL, n=13) com- pared to patients with mutations allowing for a residual activity of the receptor (median 1,472 pg/mL, n=27). In our study, the measurement of MPL expression on hematopoietic precursors was a better predictor of the clinical course than THPO levels. Unexpectedly low
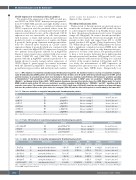
Table 2. MPL mutations in congenital amegakaryocytic thrombocytopenia patients. All mutations found in our group of congenital amegakary- ocytic thrombocytopenia (CAMT) patients are listed regarding their type in Tables 2A to D together with their predicted impact on the MPL protein and their incidence in our patient group (bold: novel mutations). 2A (nonsense mutations) and 2B (frame shift mutations): prediction according to MutationTaster21 with probability; 2C (splice mutations): prediction according to BDGP splice site prediction,22 MaxEntScan algorithm (MaxEnt),23 and Human Splicing Finder (HSF).24 MDD: maximal dependency decomposition (only for donor sites), MM: Markov model (1st order), WMM: weighted matrix method. 2D (missense mutations): prediction according to MutationTaster,21 PROVEAN,18 and SIFT19 algorithms with the respective score values.*The mutation previously referred to as c.1653+1delG (now c.1653delG) should be also regarded as a frame shift muta- tion since the predicted effect on the splice donor site is marginal (Table 2C) and the effect on the protein is caused mainly by the frame shift.56
Table 2A. Nonsense mutations in congenital amegakaryocytic thrombocytopenia patients.
CDS
c.127C>T
c.268C>T
c.367C>T
c.1230G>A
c.1378C>T
c.1431G>A
Exon protein
E2 p.Arg43Ter
E3 p.Arg90Ter
E3 p.Arg123Ter
E8 p.Trp410Ter
E9 p.Gln460Ter
E9 p.Trp477Ter
MutationTaster
disease causing / 1 disease causing / 1 disease causing / 1 disease causing / 1 disease causing / 1 disease causing / 1
incidence
ho: n=7; het: n=0 ho: n=1; het: n=0 ho: n=0; het: n=1 ho: n=1; het: n=0 ho: n=0; het: n=1 ho: n=1; het: n=0
incidence
ho: n=2; het: n=1 ho: n=3; het: n=3 ho: n=0; het: n=1
incidence
ho: n=1; het: n=1 ho: n=0; het: n=1 ho: n=0; het: n=1 ho: n=0; het: n=5 ho: n=0; het: n=1
ho: n=0; het: n=1)
CDS: coding DNA sequence; ho: homozygous individuals: het: heterozygous individuals.
Table 2B. Frame shift mutations in congenital amegakaryocytic thrombocytopenia patients.
CDS
c.235_236delCT c.378delT c.1653delG*
Exon protein
E3 p.Leu79Glufs*84 E3 p.Phe126LeufsX5 E11 p.Lys553ArgfsX75
MutationTaster
disease causing / 1 disease causing / 1 disease causing / 1
CDS: coding DNA sequence; E: exon; ho: homozygous individuals: het: heterozygous individuals.
Table 2C. Splice site mutations in congenital amegakaryocytic thrombocytopenia patients.
CDS Intron
c.79+2T>A I1 c.212+1G>A I2 c.213-1G>A I2 c.391+5G>C I3 c.1469-2A>T I9
(c.1653+1delG* I11
HSF prediction
most prob. broken donor s. most prob. broken donor s. most prob. broken acc. s. most prob. broken donor s. most prob. broken acc. s.
new donor site 1 base 5'
MaxEnt (wt/mut)
9.16/0.97 9.00/0.82 7.90/-0.85 9.14/6.25 8.25/-0.11
10.90/8.40
MDD MM (wt/mut) (wt/mut)
13.98/5.79 9.62/1.43 11.78/3.60 9.27/1.08 - 7.69/-1.06 12.18/9.98 8.32/4.76 - 9.41/1.05
15.68/12.58 10.63/7.39
WMM (wt/mut)
10.39/2.21 7.15/-1.03 6.71/-2.04 9.69/5.86 11.03/2.67
9.35/6.49
CDS: coding DNA sequence; I: Intron; ho: homozygous; het: heterozygous. HSF: Human Splicing Finder; Max/En: MaxEntScan algorithm; wt: wild-type; mut: mutant; MM: Markov model; WMM: weighted matrix method.
2442
haematologica | 2021; 106(9)
