
Page 88 - 2021_06-Haematologica-web
P. 88
M.-E.M. Percival et al.
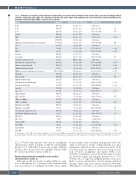
Table 1. Univariate associations between baseline characteristics and overall survival. Median overall survival (OS) (years) based on Kaplan-Meier estimates, and hazard ratios (HR), 95% Confidence Intervals (CI), and P-values from univariate Cox regression models reported. Median OS for treatment related mortality (TRM) is reported for all patients.
Factor
2014
2015
2016
Female
Male
AML
High grade myeloid neoplasm (<20% blasts) PS 0-1
PS2
PS 3-4
De novo
Secondary
Favorable cytogenetic risk
Intermediate cytogenetic risk
Adverse cytogenetic risk
Unknown cytogenetic risk
TRM score (per 1 point increase in score) On study
Not on study
High intensity therapy Intermediate intensity therapy Low intensity therapy
Age≤75
Age>75
ALT≤2xULN
ALT>2xULN
GFR ≥ 60 ml/min
GFR < 60 ml/min
Bilirubin ≤ 1.5 mg/dL
Bilirubin > 1.5 mg/dL
No solid tumor in prior 2 years Solid tumor within prior 2 years EF≥50%
EF<50%
No prior CHF
Prior CHF
No prior MI
Prior MI
Summary
114 (31) 133 (36) 125 (34) 154 (42) 216 (58) 264 (71%) 107 (29%) 300 (81) 53 (14)
19 (5) 181 (49) 191 (51) 19 (5) 226 (61) 114 (31) 13 (3) 4.59 (0, 73.25) 207 (56)
165 (44) 212 (57) 60 (16) 100 (27) 319 (86) 53 (14) 349 (95) 17 (5) 319 (87) 46 (13) 347 (95) 20 (5) 353 (97) 10 (3) 275 (98) 5 (2) 359 (96) 14 (4) 353 (95) 19 (5)
Median OS (95% CI) (years)
1.5 (1.1, 3.0) 1.2 (1.0, 2.0) 1.8 (1.1, 2.5) 2.2 (1.5, 2.8) 1.2 (1.0, 1.5) 1.5 (1.1, 2.2) 1.4 (1.1, 2.1) 1.8 (1.4, 2.4) 0.7 (0.6, 1.4) 0.2 (0.1, inf) 2.0 (1.3, 3.0) 1.2 (1.0, 1.8) NR (1.6, inf) 1.8 (1.3, 2.4) 0.9 (0.6, 1.4) 0.4 (0.1, inf) 1.4 (1.2, 2.0) 1.4 (1.1, 2.3) 1.4 (1.0, 2.0) 2.4 (1.8, 3.5) 0.7 (0.4, 1.6) 1.1 (0.9, 1.4) 1.9 (1.4, 2.4) 0.7 (0.5, 1.0) 1.4 (1.2, 2.0) 0.7 (0.6, inf) 1.8 (1.3, 2.3) 0.8 (0.5, 1.8) 1.5 (1.2, 2.1) 0.7 (0.1, inf) 1.4 (1.2, 2.1) 2.0 (1.3, inf) 1.8 (1.2, 2.4) 3.5 (0.0, inf) 1.5 (1.2, 2.1) 0.6 (0.2, inf) 1.6 (1.2, 2.2) 1.0 (0.5, 0.6)
HR (95% CI) P Reference -
1.23 (0.9, 1.68) 0.2 1.05 (0.75, 1.47) 0.78
Reference -
1.31 (1, 1.71) Reference
0.049
0.94 (0.71, 1.24) 0.64
Reference -
1.77 (1.25, 2.5)
2.73 (1.61, 4.63)
Reference -
1.41 (1.08, 1.83) 0.01
Reference -
0.0011
Reference -
<0.001
2.17 (0.96, 4.93) 3.4 (1.48, 7.8) 2.62 (0.88, 7.8) 1.05 (1.04, 1.05)
0.063 0.0038 0.083 <0.001
Reference - 1.1 (0.85, 1.43) 0.47 Reference -
2.29 (1.61, 3.26) 1.93 (1.44, 2.59)
<0.001
<0.001
2.38 (1.72, 3.3)
Reference -
Reference -
<0.001
1.11 (0.59, 2.09) 0.75
1.73 (1.2, 2.49)
Reference -
0.0035
1.49 (0.87, 2.56) 0.15
Reference - 0.84 (0.35, 2.05) 0.7 Reference -
1 (0.32, 3.15) 1
Reference -
PS: performance status; AML: acute myeloid leukemia; OS: overall survival; TRM: treatment-related mortality; ALT: alanine aminotransferase; ULN: upper limit of normal; GFR: glomerular filtration rate; EF: ejection fraction; CHF: congestive heart failure; MI: myocardial infarction; HR: hazard ratio; CI: Confidence Interval; inf: infinity; NR: not reached.
[CI]: 1.37-2.33) than patients who had no ineligibility characteristics (Table 2; Figure 1). Of the 144 ineligible patients, 73% (106) failed to meet only a single eligibility criterion, 26% did not meet two eligibility criteria, while 5% did not meet three criteria (Table 2).
Relationship between ineligibility and baseline characteristics (Table 3)
Although we did not regard secondary AML as a crite- rion of ineligibility per se, patients with secondary AML were more likely to be ineligible (P<0.001). This is likely
because many of the secondary AML patients were clas- sified as such due to receipt of chemotherapy for a prior malignancy, which in itself is a common reason for exclu- sion from trials. As expected, there were strong associa- tions between ineligibility and higher TRM scores (P<0.001). Nonetheless, rate of 28-day mortality was sim- ilar between eligible and ineligible patients (4% vs. 8%, P=0.06). Also as expected, ineligible patients were more likely to receive intermediate and less intense induction therapy, rather than more intense induction (P=0.006). Although we observed no association between eligibility
1.9 (1.04, 3.49)
Reference -
1.93 (1.18, 3.18)
0.0091
0.037
2116
haematologica | 2021; 106(8)
