
Page 70 - 2021_06-Haematologica-web
P. 70
E.R. Finch et al.
A
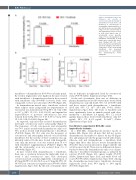
Figure 3. Fenofibrate reduces the
B
C
frequency and
osteonecrosis and arteriopathy in dexamethasone-treated mice. (A) Frequency of osteonecrosis or arteriopathy, compared with the χ2 test. (B) Necrosis scores (possible range of 0 [no osteonecrosis] to 200 [equivalent to 100% necrosis in both hind limbs]) and (C) arteriopathy scores (possible range of 0 [no arteriopathy] to 8 [thrombotic arteriopathy in both limbs]) were reduced with fenofi- brate. Median with 95% confi- dence interval (box and whiskers) and mean (triangle). Note that no control mice or mice treated with fenofibrate only developed osteonecrosis or arteriopathy. Dex: dexamethasone; Feno: fenofibrate.
severity of
fenofibrate + dexamethasone (P>0.99 at each time point). By week 6, triglycerides were higher in the mice treated with fenofibrate + dexamethasone than in those treated with fenofibrate only (P=0.005): however, levels were comparable to those in control mice (P>0.99) (Figure 2A).
In dexamethasone-treated mice, fenofibrate reduced white adipose tissue: perigonadal fat (representative of visceral fat) was reduced from 0.30 g (95% CI: 0.22- 0.54) to 0.17 g (95% CI: 0.11- 0.20; P=0.01) and inguinal fat (representative of posterior subcutaneous fat) was reduced from 0.25 g (95% CI: 0.19- 0.47) to 0.12 g (95% CI: 0.10- 0.15; P=0.0003) (Figure 2B).
As expected, only mice that received dexamethasone developed osteonecrosis and/or arteriopathy (Figure 3). The frequency of both osteonecrosis and arteriopathy was 74% in mice treated with dexamethasone only versus 33% in those treated with dexamethasone + fenofibrate (P=0.006) (Figure 3A). Not only was the frequency of osteonecrosis and arteriopathy reduced over 2-fold with fenofibrate, but the severity of these conditions was sig- nificantly reduced. In the mice treated with dexametha- sone only, the necrosis score was reduced from 75 to 0 with fenofibrate supplementation (P=6x10⁻⁵) (Figure 3B) and the arteriopathy score was reduced from 4 to 0 (P=0.0006) (Figure 3C).
In mice treated with dexamethasone + fenofibrate, there was a correlation between the triglyceride level at week 3 and osteonecrosis: mice that developed osteonecrosis had a median triglyceride concentration of 67.5 mg/dL (95% CI: 21.1-96.9) versus 37.2 mg/dL (95% CI: 30.9-53.1) in osteonecrosis-negative mice (P=0.03) (Online Supplementary Figure S1A). By the end of treatment, there
was no difference in triglyceride levels by osteonecrosis status (P>0.99) (Online Supplementary Figure S1B).
At the end of treatment, there was no difference in plasma dexamethasone levels between mice treated with dexamethasone only (26.6 nM, 95% CI: 20.0-58.3 nM) and those treated with dexamethasone + fenofibrate (20.5 nM, 95% CI: 16.7- 25.9 nM; P=0.1) (Online Supplementary Figure S2A). The levels of fenofibric acid were significantly lower in animals treated with dexa- methasone + fenofibrate (1.9 mg/mL, 95% CI: 1.6-2.4 mg/mL) than in those treated with fenofibrate only (6.7 mg/mL, 95% CI: 6.1-8 mg/mL, P<1x10⁻⁶) (Online Supplementary Figure S2B).
Fenofibrate in experimental BCR-ABL+ acute lymphoblastic leukemia
In a BCR-ABL+ dexamethasone-sensitive model of murine ALL, (Figure 4A), all mice that did not receive dexamethasone succumbed to disease by day 35 (Figure 4C), and animals in both the groups treated with dexam- ethasone only and dexamethasone + fenofibrate lived longer than those that did not receive dexamethasone (P<1x10⁻⁶). Mice were monitored for relapse until the end of follow-up at day 63. There was no difference in disease burden between the dexamethasone-only versus dexam- ethasone + fenofibrate treatment groups, as indicated by survival (P=0.49) (Figure 4C), spleen weight (P>0.99) (Online Supplementary Figure S3A), and white blood cell count (P>0.99) (Online Supplementary Figure S3B). Among the dexamethasone-treated mice, fenofibrate decreased triglyceride levels from 89.9 mg/dL to 29.0 mg/dL (P=0.001) (Figure 4D).
2098
haematologica | 2021; 106(8)
